10 ways to add value to your dashboards with maps


The most effective dashboards are insights-driven—and because many analysis projects involve some spatial data, working with maps is an important skill to have in your visualization toolbox. In this post, we’ll share 10 tips for improving the analytic and aesthetic value of maps for your dashboards.
1. Context is key
First and foremost, make sure the map you choose offers the right amount of context for your visualization. You don’t want to end up with too much visual clutter that distracts readers from focusing on the data. Let’s check out some examples with the built-in Tableau styles and some custom Mapbox maps.
In Tableau, there are three basic map styles—light, dark, and normal—built in. For most mapping use cases, this is a great place to start.
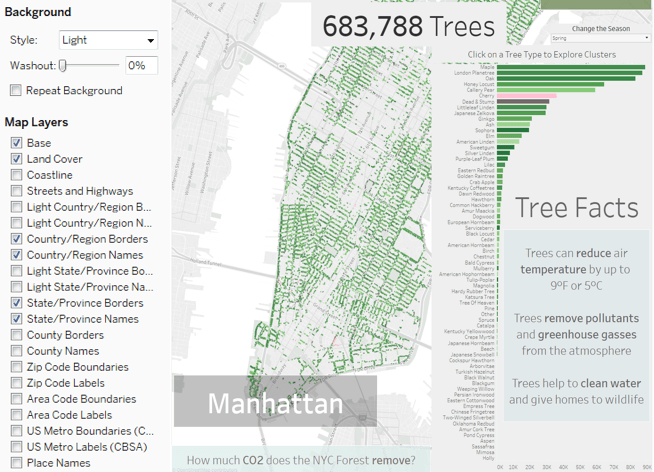
This dashboard by Ann Jackson explores urban forests in New York City. It looks clean and sharp, and provides just enough context using Tableau’s Light base map, which is adjusted to show only the land cover and streets.
On the other hand, when a map needs to be the most important visualization on the dashboard, it will need something extra to make it pop. Consider adding relevant colors, layers, and text to your map, or design a custom base map with Mapbox.
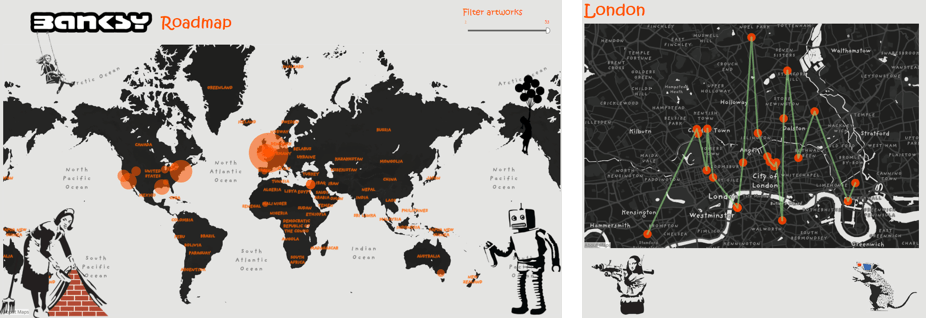
This dashboard by Andre Oliveira, “Graffiti Around the World,” uses a simple base map with custom labeling. The layers are zoom-level dependent and, when the dashboard zooms to city-scale data, we see a clean and simple map with just a bit of added local detail. The color coordination between base map and data (as well as the introduction of great artistic detail in the “empty space” in the oceans) makes the map on this dashboard shine.
2. Let the data stand on its own
A good visualization focuses the reader’s attention on the data, not the background, so occasionally it helps to let spatial data speak for itself—without a base map. When working with familiar locations and shapes—like all counties in a state, or all countries in a continent—there’s likely enough spatial awareness to remove the base map.
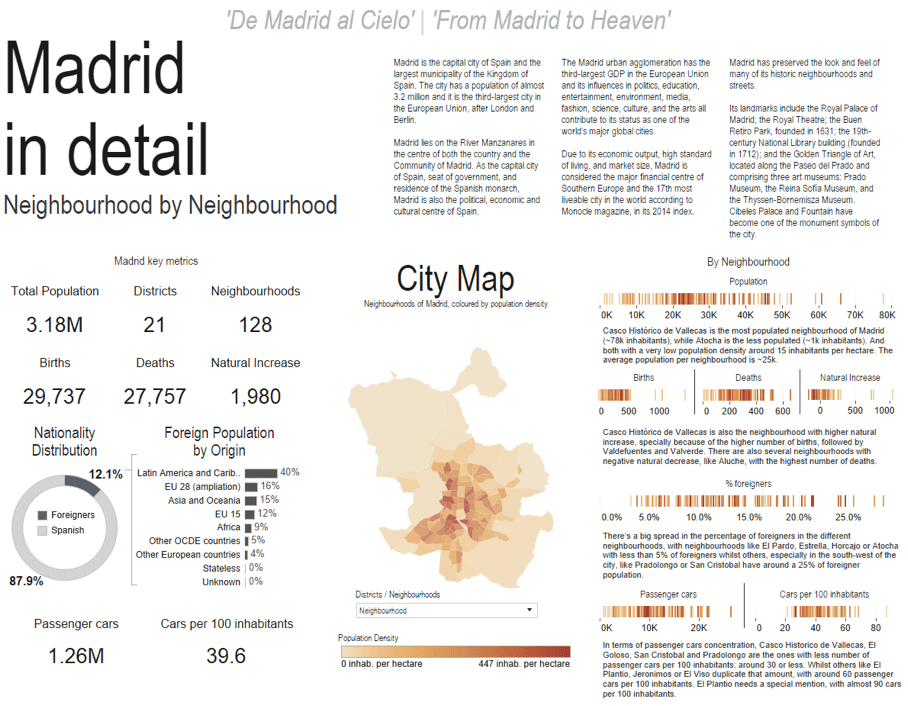
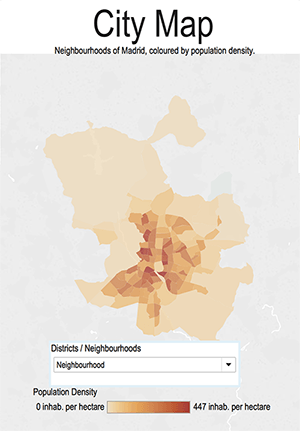
For instance, this dashboard by Pablo Saenz de Tejada shows the demographics of Madrid, Spain, without a base map. Removing the fine details of the map makes for a cleaner, less distracting design when integrating the map into the dashboard. Compare this to the same dashboard with a small bit of base map content turned on; it isn’t bad, but it’s not as seamless as the original:
3. You don’t need a legend on your map*
I’m a cartographer, so you’ll rarely hear me say outright: “You don’t need a legend.” (Hence the asterisk in this tip.) *You don’t need a legend if you can use the other vizzes in your dashboard to clarify chosen colors, sizes, shapes, and symbols.
You can save a lot of space, and emphasize the connections between vizzes on your dashboard by working in vizzes as legends, where the meaning of symbols are explained through another interactive object.
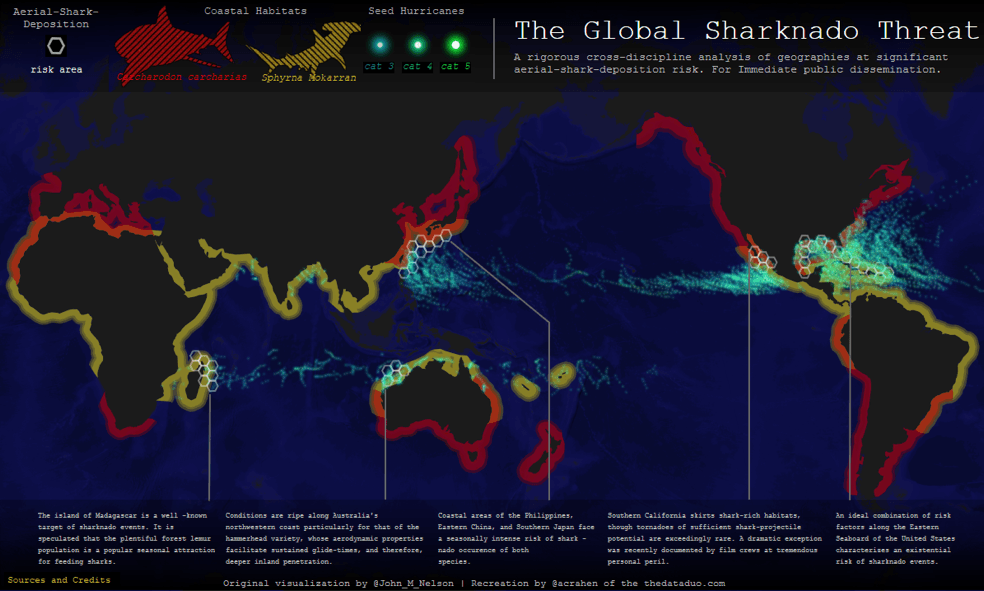
For instance, this visualization of Global Sharknado Threat by the Data Duo relies on a “shark legend” worksheet with profile images of two sharks. The sharks are color-encoded so that they can serve as a legend and filter for the map.
It’s easy to set this up on a dashboard. You’ll need to use a separate worksheet to serve as your legend viz and to set up actions linking your ‘legend’ to the other worksheets on your dashboard.
The Sharknado viz legend is actually a scatterplot with the placement of the two sharks based on a calculated field for their X and Y values. Then custom shark-shaped markers in the same color scheme as the data on the map are added to the viz.
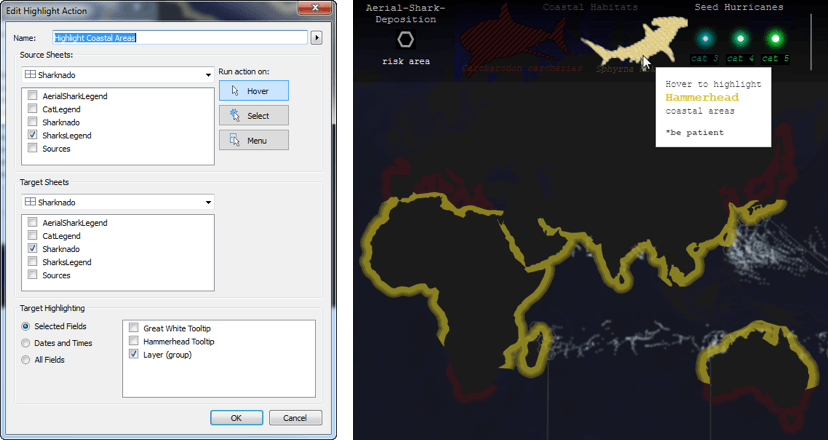
This legend does a double duty; it provides a graphical indicator of the shark type and explains the yellow and red colors on the map. To make the legend interactive, it just needs a dashboard highlight action, so when you hover over one of the legend sharks it highlights the appropriate shark habitat data in the map.
4. Use a map as a filter
Similar to using a second viz as a legend, you can also think about how a map viz can serve as a filter to facilitate exploration on your dashboard. Geographic shapes can be better filters than dropdown lists of text. Not only do they provide a better visual cue of which region is selected, they also allow people to easily select neighboring regions of interest for deeper exploration.
This dashboard by Decisive Data, “The Path to Prosperity,” shows how giving impacts the lives of people in seven different villages in Honduras and Nicaragua. This dashboard makes great use of a small map, used as a filter, between the two countries. It’s a graphic element that fits in with the design, and it’s a visual reminder of the relative locations of the highlighted countries.

5. Use highlighting actions
Tableau is magical when it comes to setting up highlighting actions across worksheets, so take advantage of these in your maps and dashboards.
Ken Flerlage's dashboard’s exploration of gerrymandering in the U.S. makes sure that readers can stay oriented on each of six different maps with different boundaries, to help readers understand how political districts have changed over time.
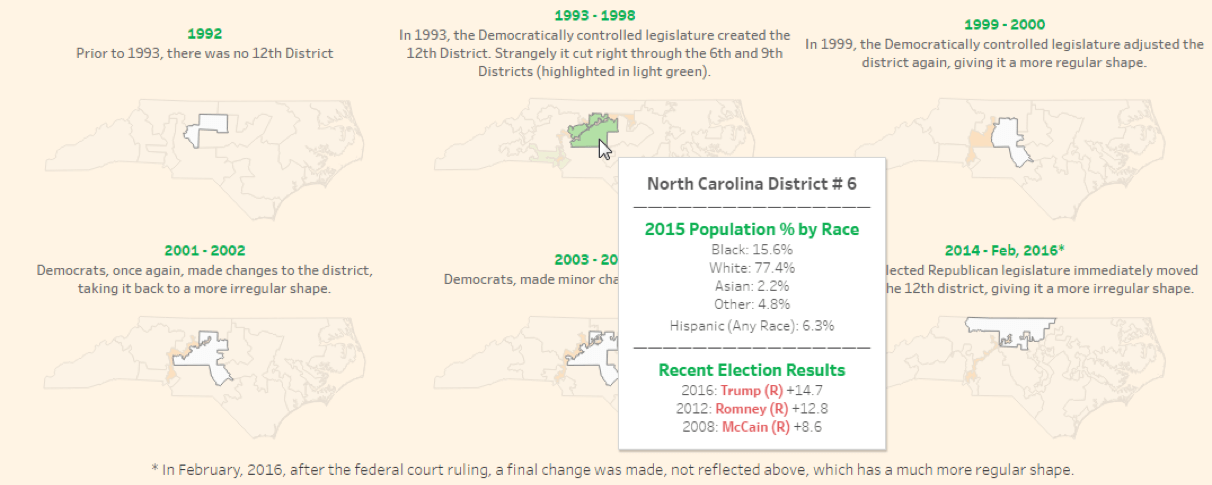
By setting up a highlight action based on the district number, the reader can explore one district at a time. Otherwise, it’s too overwhelming to see the patterns of change with the complicated borders on each map.
6. It’s all about color for design and data
With multiple worksheets on a dashboard, be sure to take advantage of the design tools in Tableau to better integrate the map into your design. You’ll also want to make sure that the colors for data on the individual dashboards match up.
To seamlessly fit your map into your dashboard, use the color picker. Match colors so that the map complements your dashboard’s overall design. This works for adjusting colors for the marks on the map as well as for matching backgrounds on the base map (and for the text boxes or other worksheets on a dashboard).

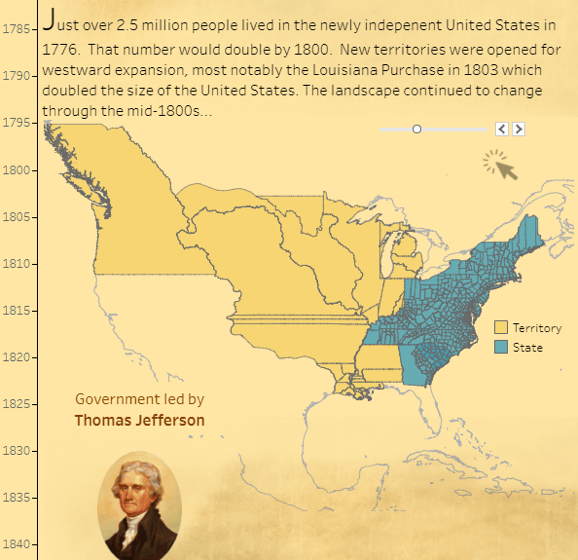
You can see where the color picker helped Joshua Milligan's dashboard, “The History of the US,” as the Viz shows off this tip by using a parchment-looking background in the viz.
Also, for your data, make sure that the colors that you use have the same values across all of the vizes on the dashboard. Inconsistently replicating colors will make it nearly impossible for most readers to correctly interpret the data.
Consider an example where we compare the number of commercial and residential building permits issued around the Las Vegas, Nevada area. If we use the default color encoding for both maps we have a huge difference in the meaning of the green shades because there were so many fewer commercial construction permits.
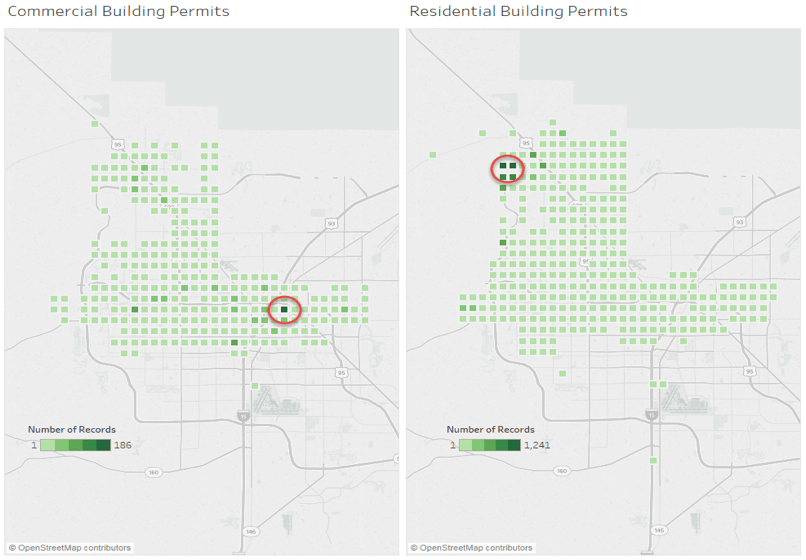
If a reader isn’t paying close attention to the two legends, they might assume that there were the same number of permits issued in the two circled locations – even though there really were over 1,000 more residential permits in the densest area!
Now compare that to a dashboard with the two maps using the same range of values for the color encoding and the pattern is very different!
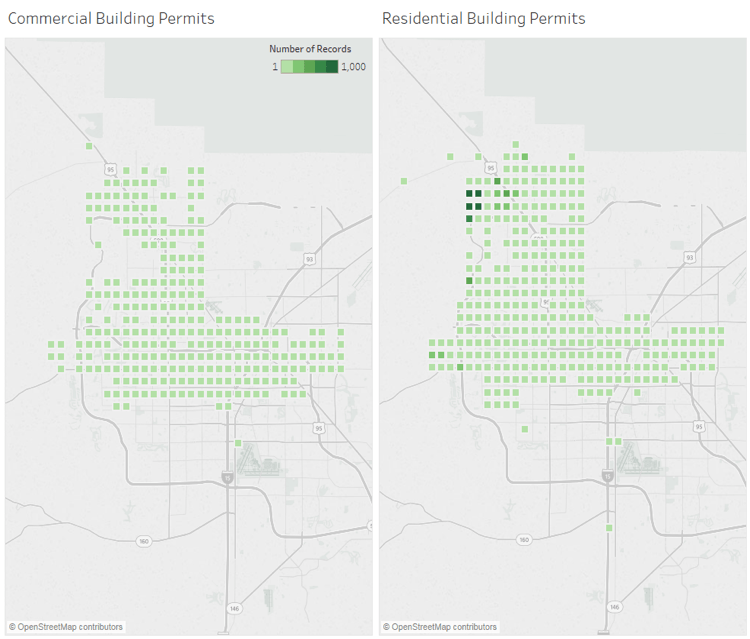
By using color correctly, we can make direct comparisons about how many permits were issued in different places around the city.
7. Represent geography in the best way to tell your data story
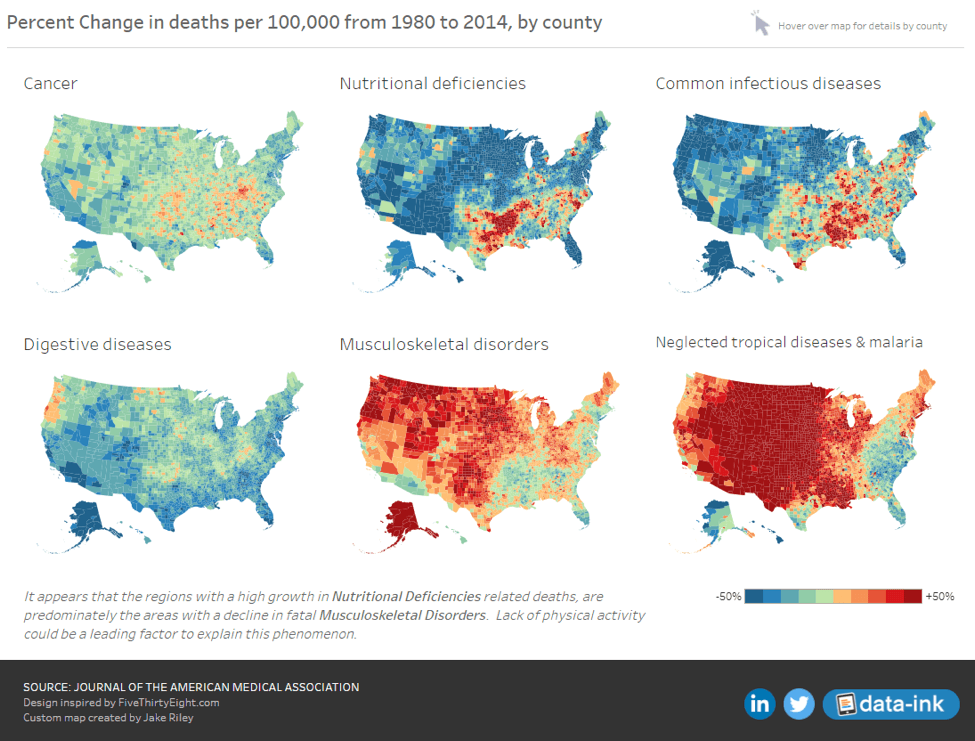
Sometimes the most effective data maps tell little white lies—and that’s okay! In this dashboard by Josh Tapley and Jake Riley, which shows causes of mortality around the U.S., the author moved Alaska and Hawaii to new locations so that the view of the U.S. fits in a smaller footprint.
In Tableau, using “inset” maps allows a user to interact directly with the data in a single worksheet, instead of having to use separate worksheets for the continental U.S., Alaska, and Hawaii. The authors adjusted the map projection to provide a different look than the normal base map.
If you want to try this out in your maps, take a look at this community discussion on alternate projections (and moving geography) in Tableau.
For more inspiration, check out this dashboard on energy sources for U.S. states using a hexagonal grid, or this exploration of crime in the U.S. using a square grid.
8. Be creative with shapes
By default, a worksheet is a rectangular shape on a dashboard—but your map doesn’t have to be that limited. Because geographic features are rarely a nice rectangle in shape, try experimenting with a different look to spice up your layout.
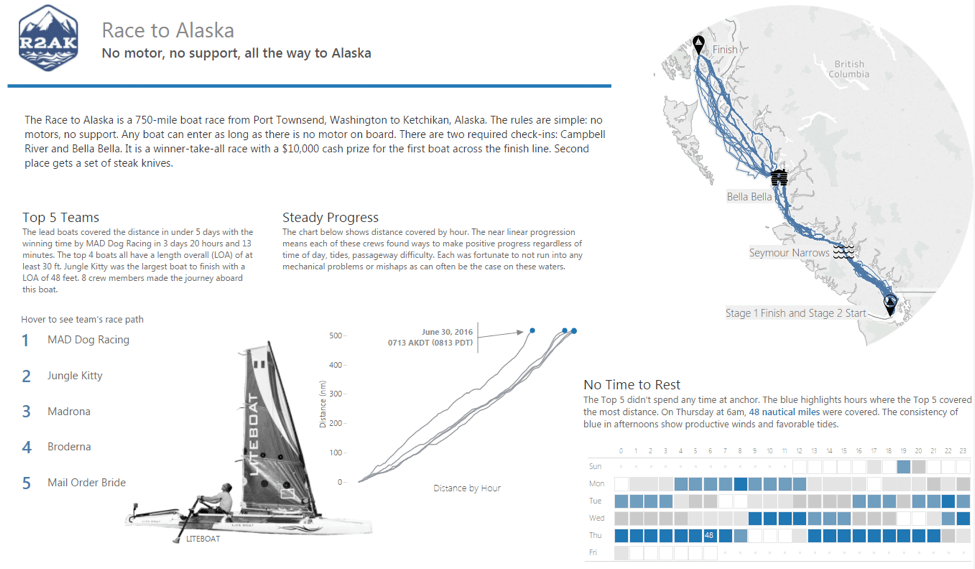
For exploring the “Race to Alaska,” Anthony Gould shows great use of a hollow, circular graphic to trim his map to a custom shape. It’s a great hack to float an image on top, effectively cropping the map.
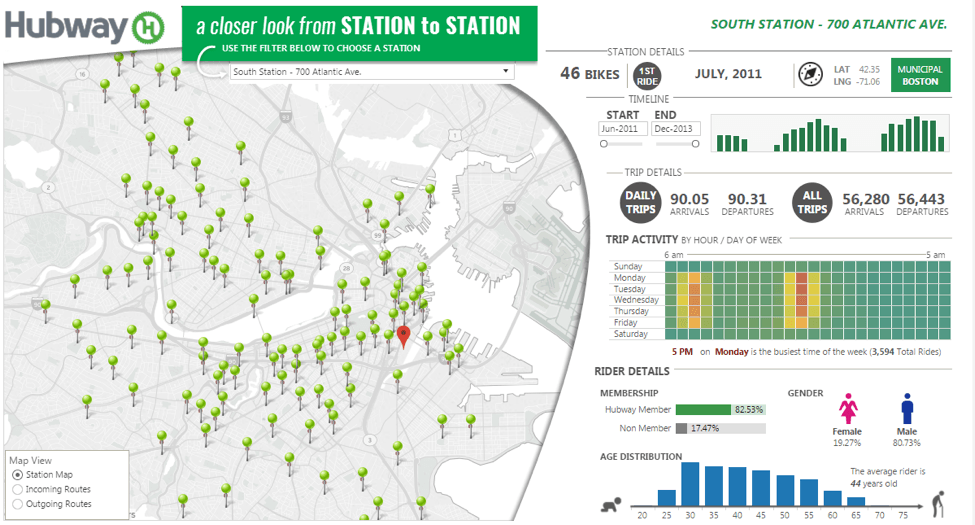
In another example, this dashboard by Brian Halloran, “Hubway bike share system in Boston,” shows off the same trick, with a useful drop shadow effect added in to clearly differentiate the controls of the dashboard.
9. Sometimes static graphics work too
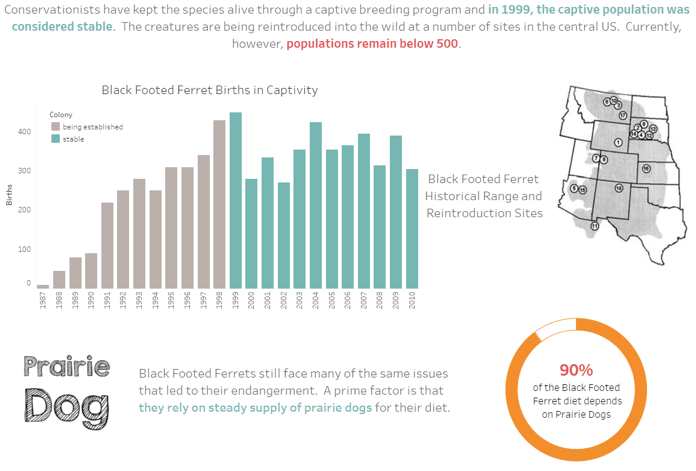
Sometimes a static graphic is all that you need to tell the whole data story. For something simple, where the map is just a reference and doesn’t need to be interactive, consider using just a graphic instead of a worksheet.
This dashboard, about the black footed ferret (BFF) by Becca Cabral, relies on a simple image of a map to show the animal’s historical range. The static map image is a perfect fit into the design to complement the interactive vizzes telling the story of her BFF.
10. Consider locking down pan and zoom
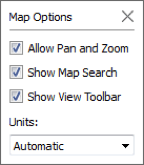
If you are using a map where it isn’t critical for a reader to zoom in and look at detailed locations, you can lock down panning and zooming.
This prevents the user from accidentally changing the display, which is particularly useful for those exploring data on a mobile device or small screen. Locking the extent of the map is easy to do, just select Map > Map Options, and then uncheck the “Allow Pan and Zoom” option.
Here is a great example by Yvan Fornes of how this tip can help communicate the data story—which in this case is the number of daylight hours by location.
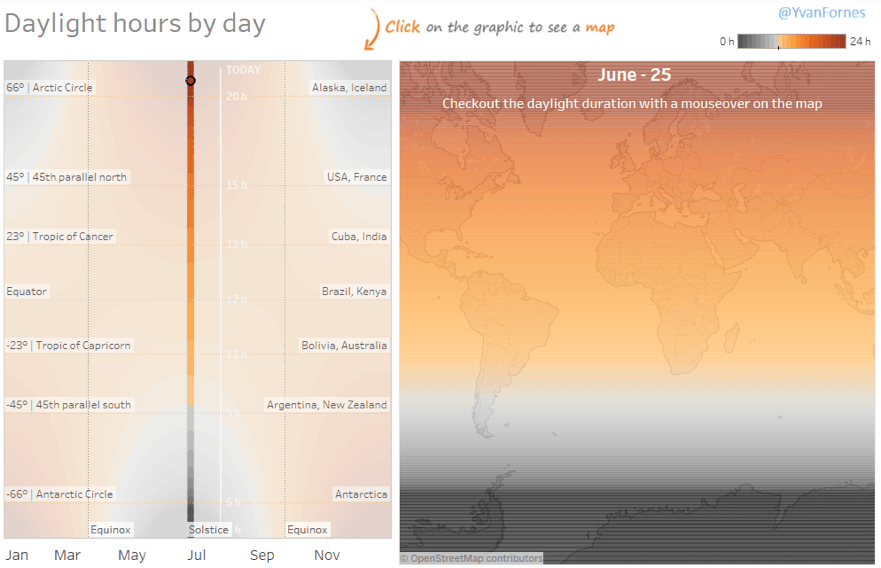
The full extent of the map is always relevant for this viz, so it is great to make sure users don’t accidentally pan or zoom away from their insights!
If you want to learn more about using maps in Tableau check out this free tutorial. You’ll learn how to get started working with geographic data, learn how to use the marks card and other map options to enhance your analysis.
Histórias relacionadas

Visualizing Women's Impact to History Through Data Visualization
 18 Março, 2024

Behind the Viz: Adrian Zinovei Helps You Design Your Next Dashboard
1 Março, 2024

Charting the Heart: Data Visualizations on Love
 14 Fevereiro, 2024
Subscribe to our blog
Receba em sua caixa de entrada as atualizações mais recentes do Tableau.