Released December 2015
Calling All Data

Satisfy your data craving with Tableau Mobile for iPhone. Now you can check your favorite vizzes from anywhere.
Tableau 9.2 also delivers on many user requests, from data prep refinements to Totals Control, which got more than 500 votes on the Tableau Ideas Forum.
And take your geographic analysis further with Mapbox integration. A leading map platform lets you drop in satellite imagery or other custom maps with a few clicks. We’re also bringing a slew of new enterprise features including project level permissions, updated connectors and new authentication technologies.

Mobile
Tableau is on the iPhone. Tap through the native app to see and understand your data. Plus you can get offline snapshots of your favorite vizzes. Now you can view your favorite vizzes anywhere, even on the subway.
It's even easier to find the content you need with Faceted Search in Tableau Mobile. Easily filter by owner, project, format, or tag. Tableau Mobile is now location-aware. Easily find your location on a map with a single tap.

Mapping
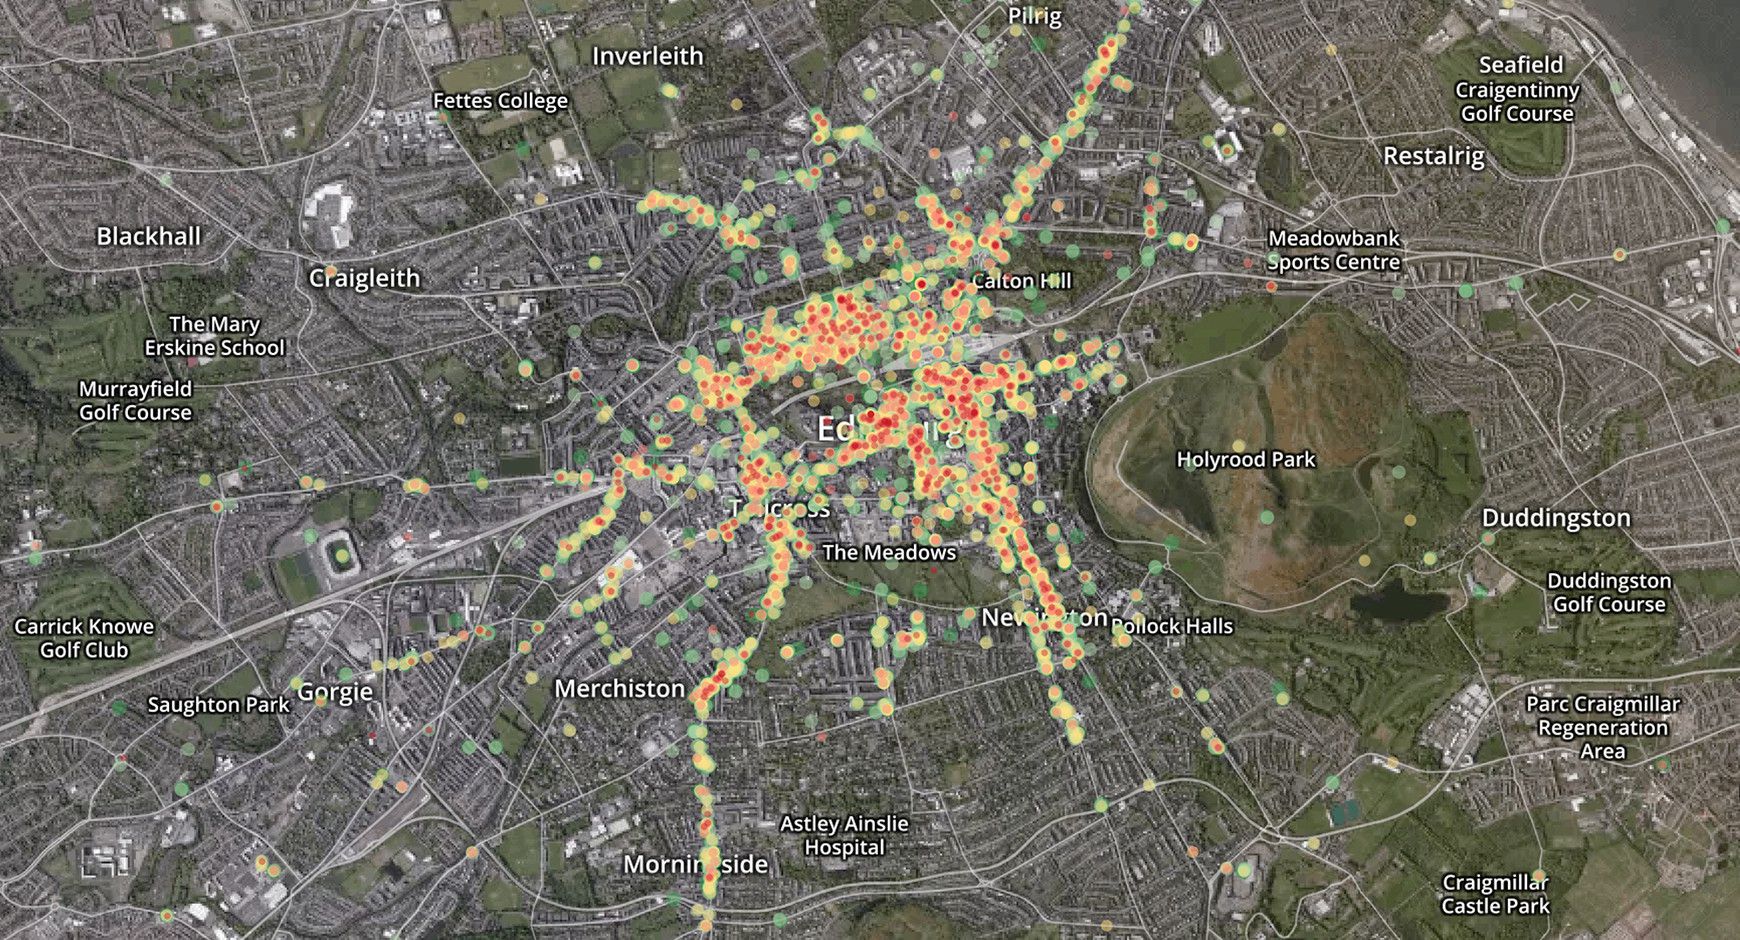
Dive deeper into your geographical analysis with new mapping data and formatting options. Tableau 9.2 comes with Mapbox integration, which lets you build gorgeous map backgrounds and add layers and context. Build the map your data deserves.
Tableau 9.2 also comes with more geographical data built in, including updated US congressional districts, local name synonyms for world capitals, Japanese postal codes and more. Plus you can customize how people interact with your map with the new Map Options Dialog. Change display options for pan and zoom, map search, and the view toolbar.

Visual Analytics
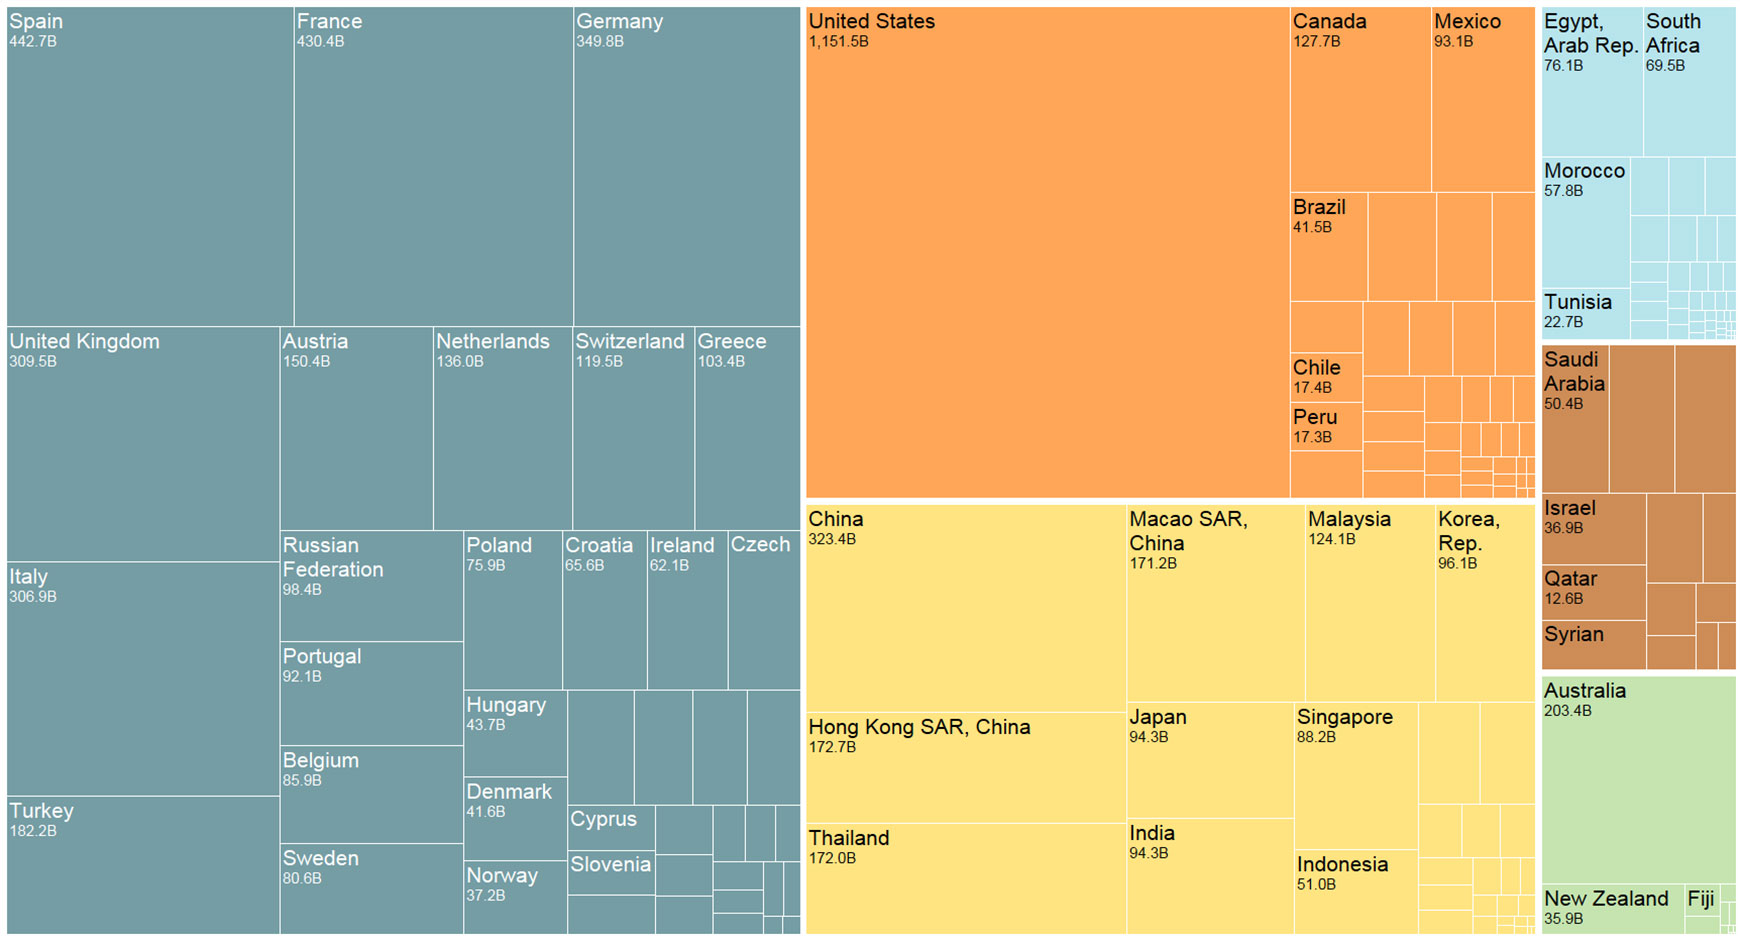
Answer questions of your data with expanded visual analytics capabilities. Many of these visual analytics features came from our user driven Ideas Forum. Treemaps now show hierarchical data, by introducing borders around the first level of grouping. And you can put totals and subtotals where you want them: top or bottom, left or right.
Additionally, you can now match label colors to mark colors for at-a-glance understanding. Optimize the axis range for analysis by fixing one end of your axis.

Data Prep
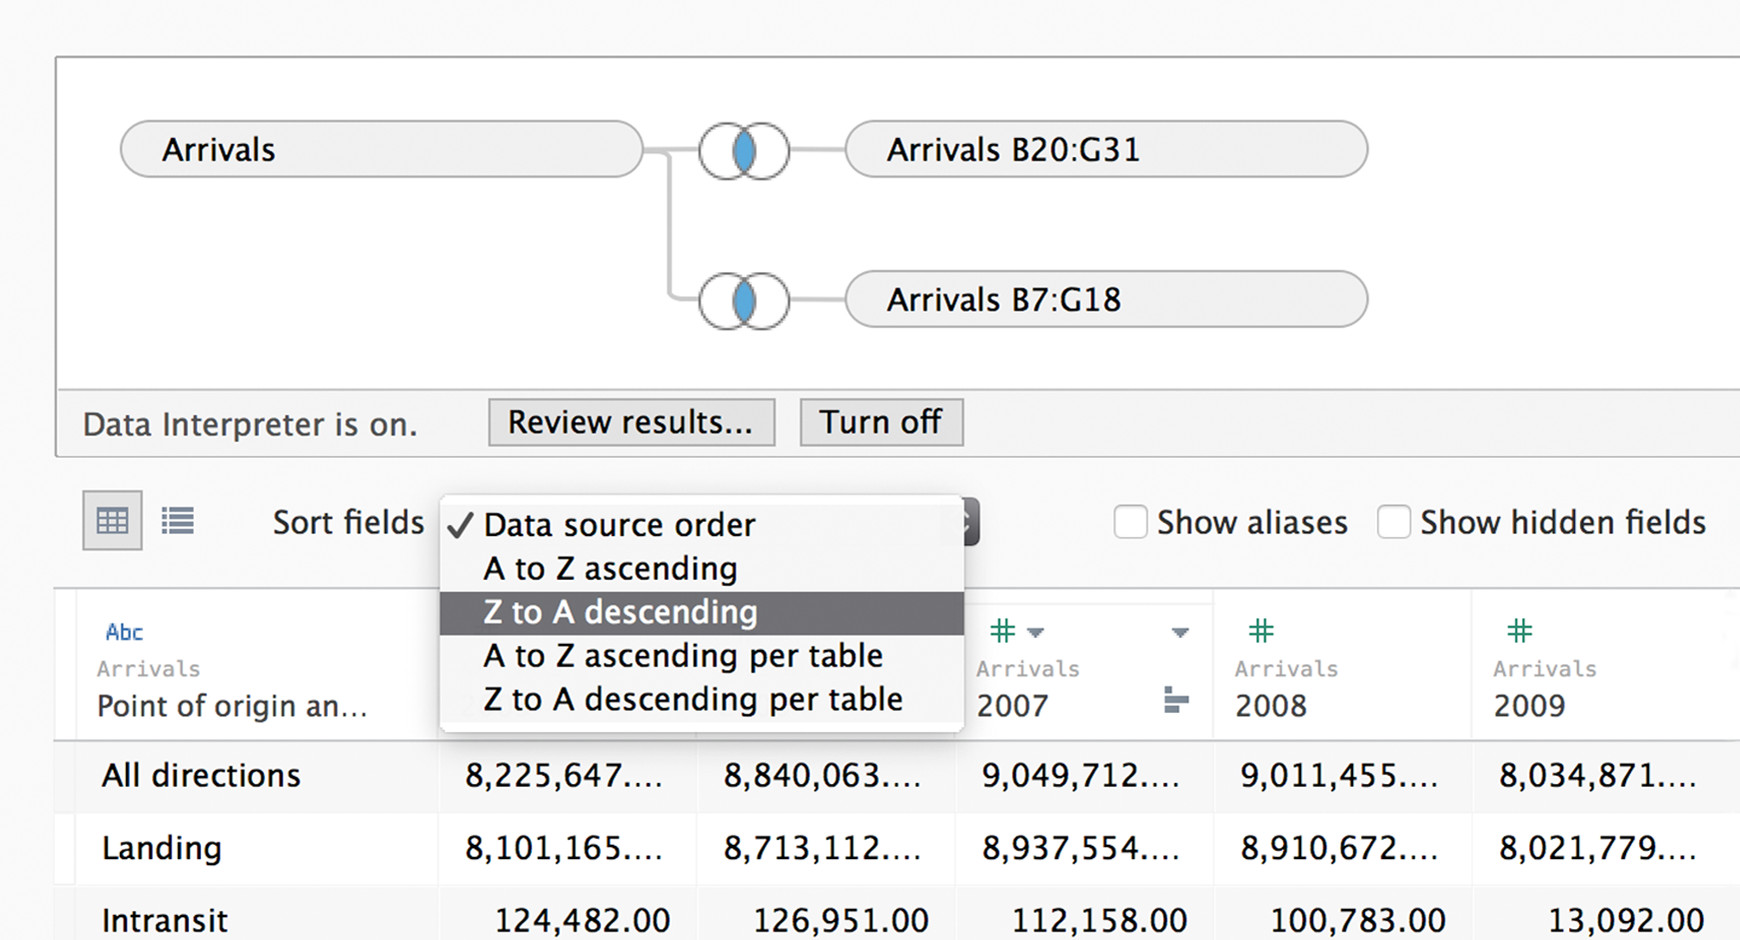
Data can be messy. Clean it up with new data prep enhancements. Tableau can automatically detect sub-tables and convert them to connection-friendly tables with Tableau’s Data Interpreter. Craft the ideal data source: sort columns and rows, edit column names, and create calculations directly in the data grid. Quickly search and change a field’s data type with the updated data pane.

Enterprise
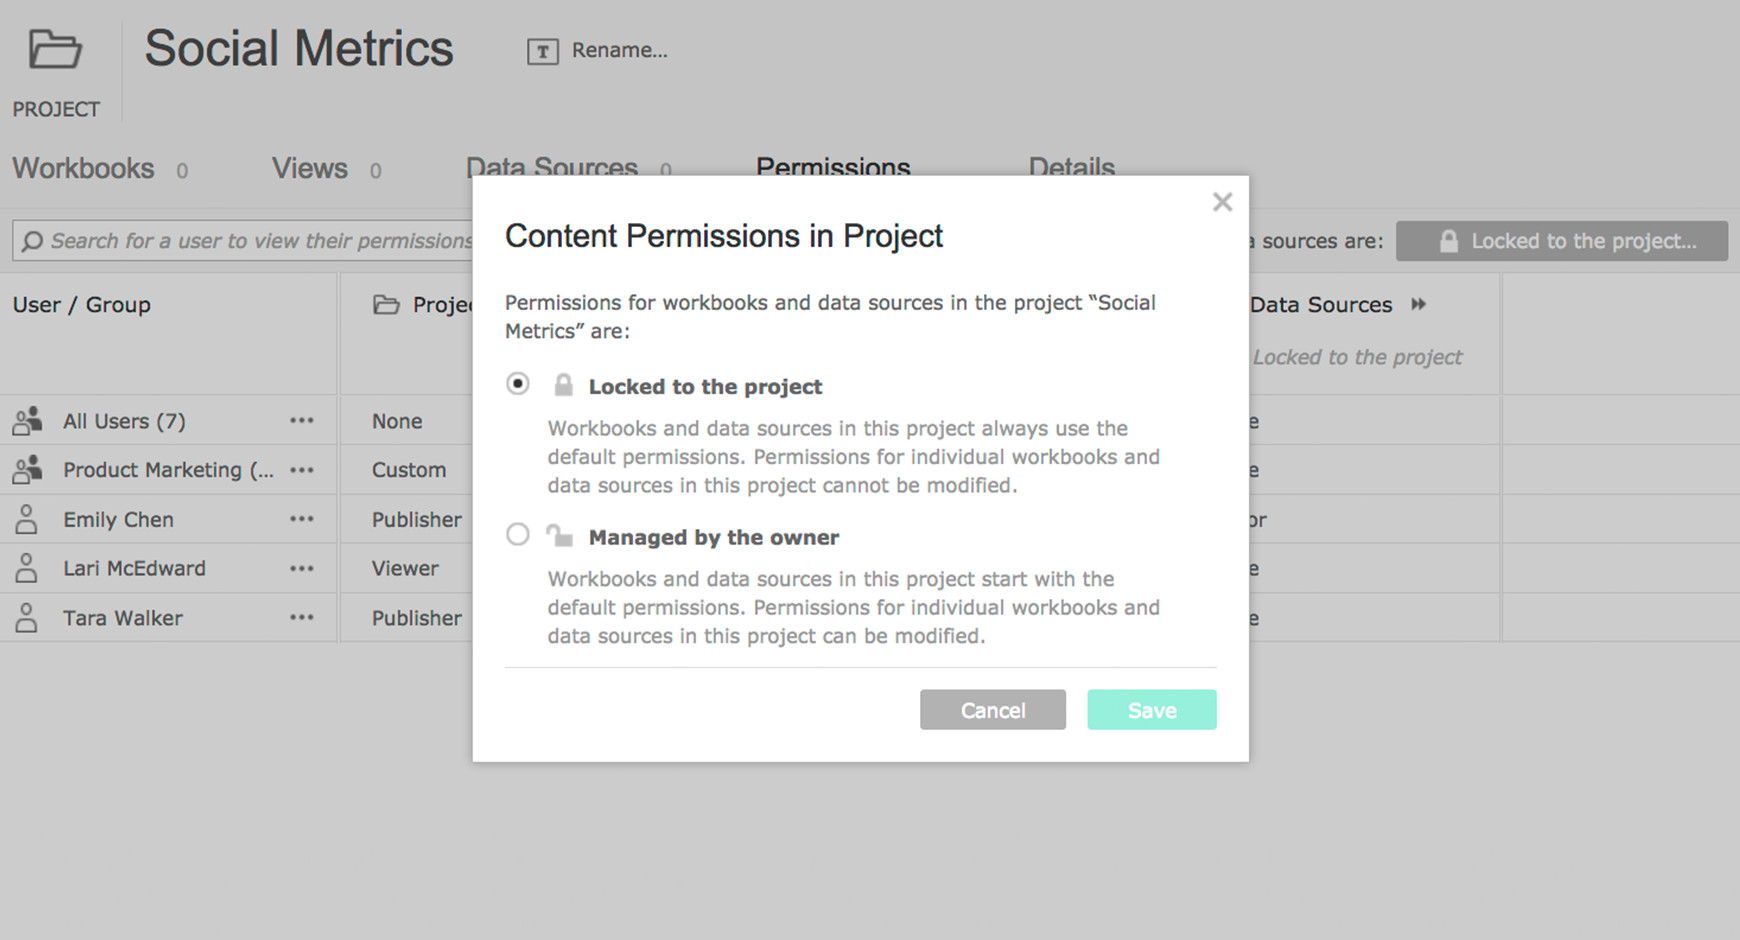
Enjoy new authentication, performance, and governance features for your enterprise deployment. Projects now get their own permissions separate from Workbook and Data Source defaults, allowing for more flexible configurations. Administrators and project leaders can now lock a project’s permissions so they automatically apply to all workbooks and data sources in the project and cannot be changed by authors.
The new toolbar puts commonly used actions at your fingertips and scales for different screen sizes.