DataFam Roundup: May 2 - 6, 2022


Welcome! Dig into this week's DataFam Roundup—a weekly blog that brings together community content all in one post. As always, we invite you to send us your content—and the DataFam content from your peers that have inspired you! Find the content submission form here.
DataFam content
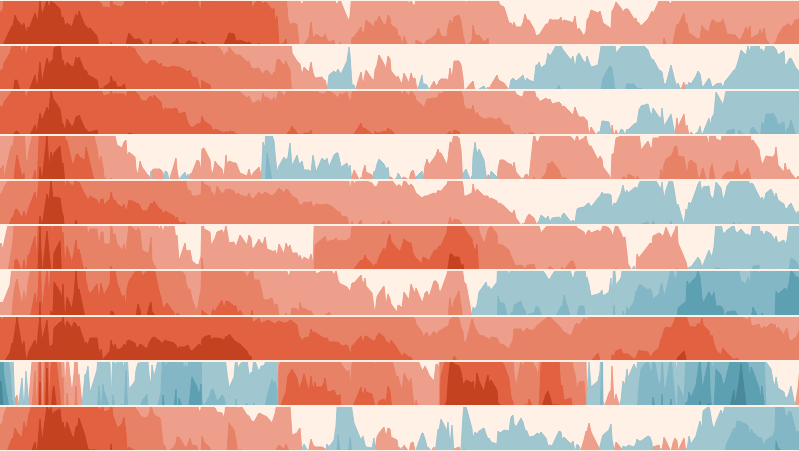
Marc Reid, datavis.blog: How to Create Horizon Charts in Tableau
Dive into content created by the Tableau Community:
- Ted Cuzzillo, Datadoodle: Former Tableau CMO Elissa Fink tells how she and her team put the once-scrappy startup on the data industry's map
- Ansula Jain, Techi Anshi: How to Register for Tableau Conference 2022 | Virtal Event TC22
- Marc Reid, datavis.blog: How to Create Horizon Charts in Tableau
- Video tutorial: Creating Horizon Charts in Tableau
- Chimdi Nwosu, VizSight: Why You Should Participate in Tableau’s Vizzie Awards
- Nicole Lillian Mark, SELECT * FROM data: The Incredible Women of Data Visualization
- Dawn Harrington, Tech Tips Girl: How to Union Your Data in Tableau
- Tim Ngwena, Tableau Tim: Installing Tableau Server: Part 1 - Windows Basic Installation
- Cndro: Data Blending in Tableau
Team Tableau
Register for Tableau Conference 2022, happening virtually and in-person
- Priya Padham: 10 ways to make meaningful virtual connections at Tableau Conference 2022
- Sarah Bartlett: 10 ways to connect with your data community—in person at Tableau Conference 2022
- Annabelle Rincon, Patrick McCormick: Better together—why the Tableau Community is like a group of cyclists
- Who are the finalists of the 2022 Iron Viz Qualifiers?
Upcoming events and community participation
- May 10, 2022: My Tableau Story with Visionary Adam Mico: "Your breakthrough is coming regardless of a label." Learn how Adam has transformed his professional and personal life since joining the Community in 2019.
- Stay up to date with the latest and greatest from the Tableau Community. We'll help you along in your Tableau journey, bring your data skills to the next level, and nurture powerful connections.
- Sign up to be a panelist for the 3charts@3 Live: A Mystery Chart Show featuring topics like personal finance, energy, healthcare and more!
- Your Future in Data Analytics, Maggy (Martina) Muellner: aims to support the next generation of DataFam members in gaining/improving their Tableau skills, support them in making their resume "hire friendly" and give advice on personal marketing on LinkedIn.
- Data Book Club, Spring 2022 Selection: Upstream: The Quest to Solve Problems Before They Happen by Dan Heath
- The 2022 Vizzies Award Nominations: The Tableau World Podcast established the Vizzies as a way to recognize individuals in the Tableau community who are not recognized through the visionary program. It is our goal that these awards are diverse and inclusive of the Tableau community. Nominations are open through May 6th. Winners will announced live on stage at TC22!
Vizzes
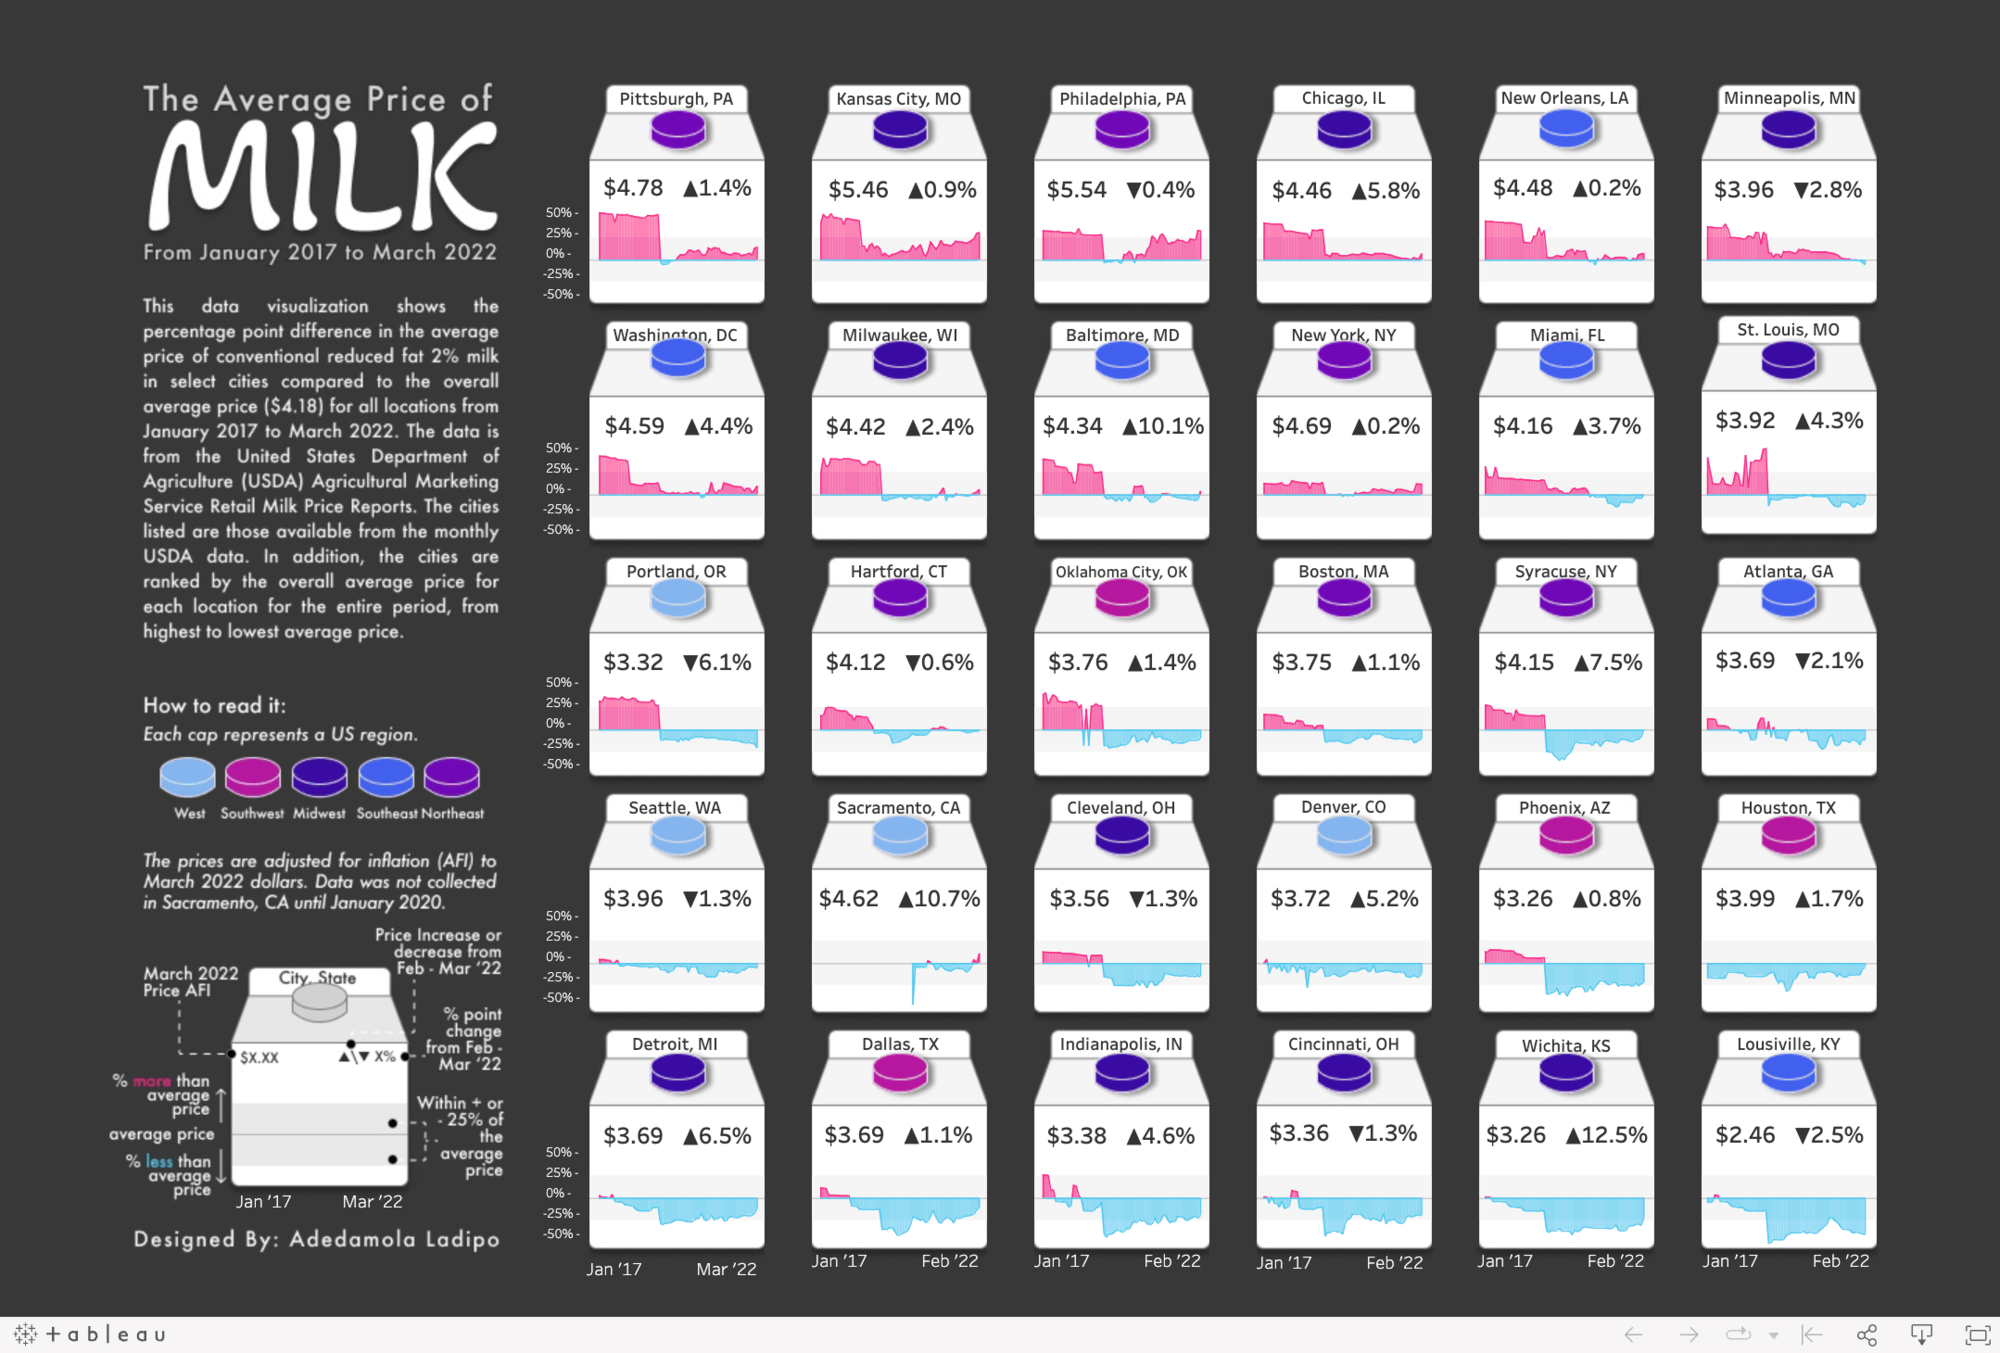
Adedamola (Damola) Ladipo: The Average Price of Milk
See the latest Viz of the Day, trending vizzes, featured authors, and more on Tableau Public.
Check out some inspirational vizzes created by the community:
- Joti Gautam: Cracking the Rubik's Cube
- Fred Najjar: Top 100 Universities 2022
- Adedamola (Damola) Ladipo: The Average Price of Milk
- Autumn Battani: Manufacturer Table
- Naresh Suglani: Nuclear Reactors - The World Landscape
- Tavish Gupta: #B2VB | Week 8 - Build a Heat Map
Community Projects
Back 2 Viz Basics
A bi-weekly project helping those who are newer in the community and just starting out with Tableau. Not limited just to newbies!
Web: Back 2 Viz Basics
Twitter: #B2VB
Week 9: Build a Dot Plot
Workout Wednesday
Build your skills with a weekly challenge to re-create an interactive data visualization.
Web: Workout Wednesday
Twitter: #WOW2022
Week 17: Can you Optimize this?
Preppin' Data
A weekly challenge to help you learn to prepare data and use Tableau Prep.
Web: Preppin’ Data
Twitter: #PreppinData
Week 17: Un-pivoting
DataFam Con
A monthly challenge covering pop culture and fandoms.
Web: DataFam Con
Twitter: #DataFamCon
May 2022: May the 4th be With You DataFam
EduVizzers
A monthly project connecting real education data with real people.
Web: Eduvizzers
May 2022: Top University Social Media Rankings – 2021
Data Plus Music
A monthly project visualizeing the data behind the music we love!
Web: Data Plus Music
Twitter: #DataPlusMusic
February 2022: MIDI Music Analysis
Games Night Viz
A monthly project focusing on using data from your favorite games.
Web: Games Nights Viz
Twitter: #GamesNightViz
May 2022: Level 4: The Need for Speed
Iron Quest
Practice data sourcing, preparation, and visualization skills in a themed monthly challenge.
Web: Iron Quest
Twitter: #IronQuest
March 2022: Music Firsts
Storytelling with Data
Practice data visualization and storytelling skills by participating in monthly challenges and exercises.
Web: Storytelling with Data
Twitter: #SWDChallenge
May 2022: embracing constraints
Project Health Viz
Uncover new stories by visualizing healthcare data sets provided each month.
Web: Project Health Viz
Twitter: #ProjectHealthViz
January 2022: One Year of Sleep
Diversity in Data
An initiative centered around diversity, equity & awareness by visualizing provided datasets each month.
Web: Diversity in Data
Twitter: #DiversityinData
March 2022: Refugees in Ukraiune and Women in the Global Workforce
SDG Viz Project
Visualize data about Sustainable Development Goals provided by the World Health Organization.
Web: SDG Viz Project
Twitter: #TheSDGVizProject
Sports Viz Sunday
Create and share data visualizations using rich, sports-themed data sets in a monthly challenge.
Web: Sports Viz Sunday
Twitter: #SportsVizSunday
April 2022: Indy 500
Viz for Social Good
Volunteer to design data visualizations that help nonprofits harness the power of data for social change.
Web: Viz for Social Good
Twitter: #VizforSocialGood
Real World Fake Data
Create business dashboards using provided data sets for various industries and departments.
Web: Real World Fake Data
Twitter: #RWFD
Session 2: SAP Concur (Employee Expenses)
Viz 2 Educate
Each month, create vizzes on global education syllabus topics as resources for teachers worldwide.
Web: Viz 2 Educate
Twitter: #Viz2educate
February 2022: Food & Nutrition
Makeover Monday
Join the community every Monday to work with a given data set and create better, more effective visualizations.
Web: Makeover Monday
Twitter: #MakeoverMonday
Verwante verhalen

DataFam Roundup: April 8–12, 2024
 12 april, 2024
DataFam Roundup: April 1–5, 2024
5 april, 2024
DataFam Roundup: March 25–29, 2024
29 maart, 2024
Subscribe to our blog
Ontvang de nieuwste updates van Tableau in je inbox.