DataFam Roundup: June 7 - June 11, 2021


Dig into the latest DataFam Roundup—a weekly blog that brings together community content all in one post. As always, we invite you to send us your content—and the DataFam content from your peers that have inspired you! Find the content submission form here.
Celebrating Pride Month
Pride Month is a celebration of the impact that the LGBTQ+ community has had on making this world a better place. We are thrilled to be launching a new Pride exhibition in the Tableau Public Viz Gallery during the month of June - we hope you’ll take the time to explore the gallery and walk away feeling like you learned something new. Check out all the featured authors in this exhibit here.
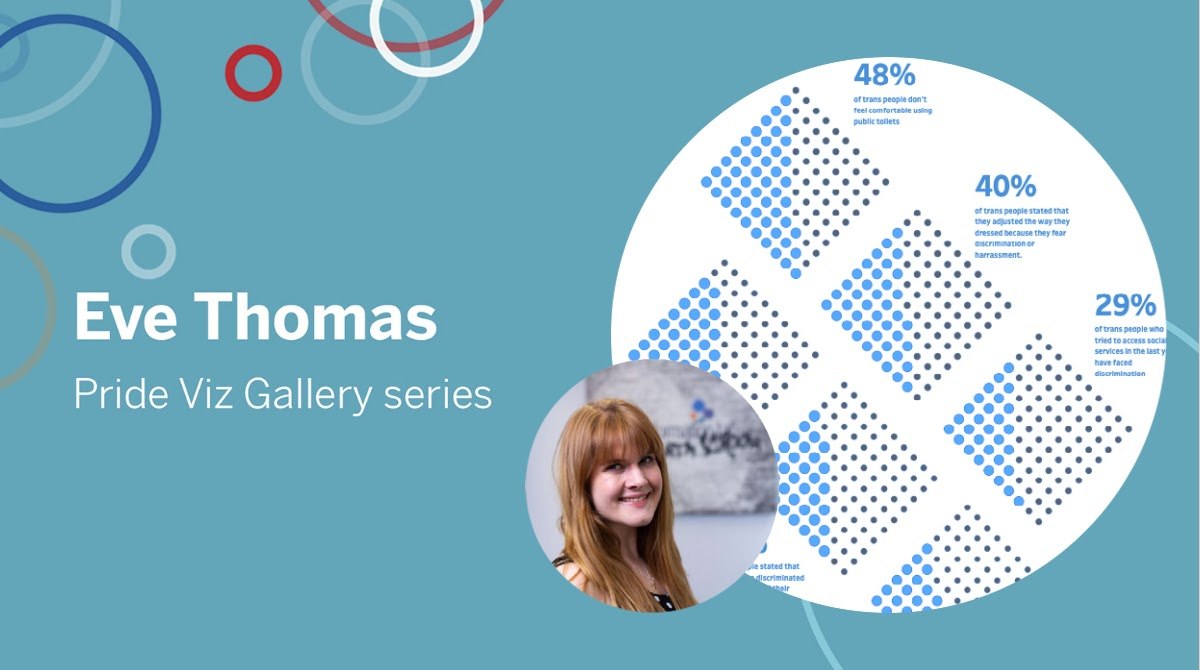
Learn more about Eve Thomas, her featured visualization ‘THE TRANS REPORT - Transgender Inequality in the UK’, and her experiences with the Tableau Community in this featured blog post.
DataFam content
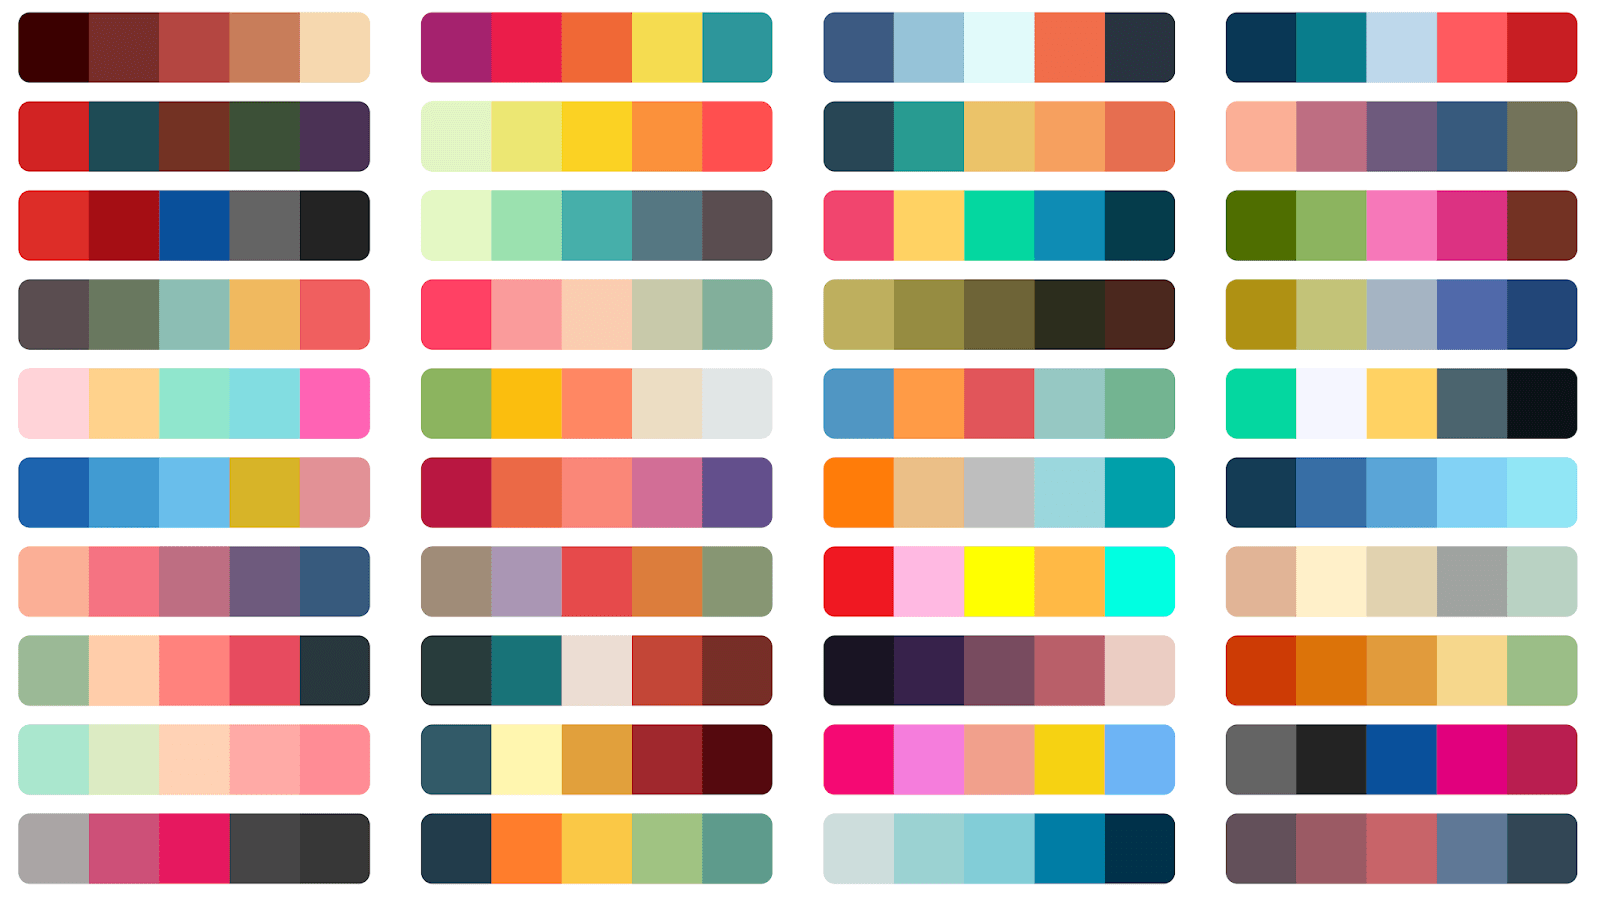
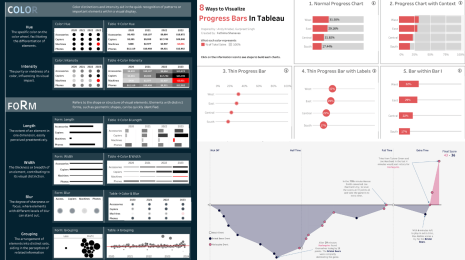
Datafam Colors: A Color Palette Crowdsourcing Project Ken Flerlage
Dive into content created by the Tableau Community:
-
IronViz Is Here! Don’t miss out Priyanka Dobhal
-
Datafam Colors: A Color Palette Crowdsourcing Project Ken Flerlage
- How to Calculate the Most Frequent Value of a Measure Andy Kriebel
- Reasons to Enter Iron Viz 2021 Sarah Bartlett
- The MID Function in Tableau Tim Ngwena
- Tell the people when your extract updated with automatic updated at times Matt Francis
- Do No Harm Guide: Applying Equity Awareness in Data Visualization Jonathan Schwabish
- Real World Fake Data ; A Retrospective Mark Bradbourne
Upcoming events
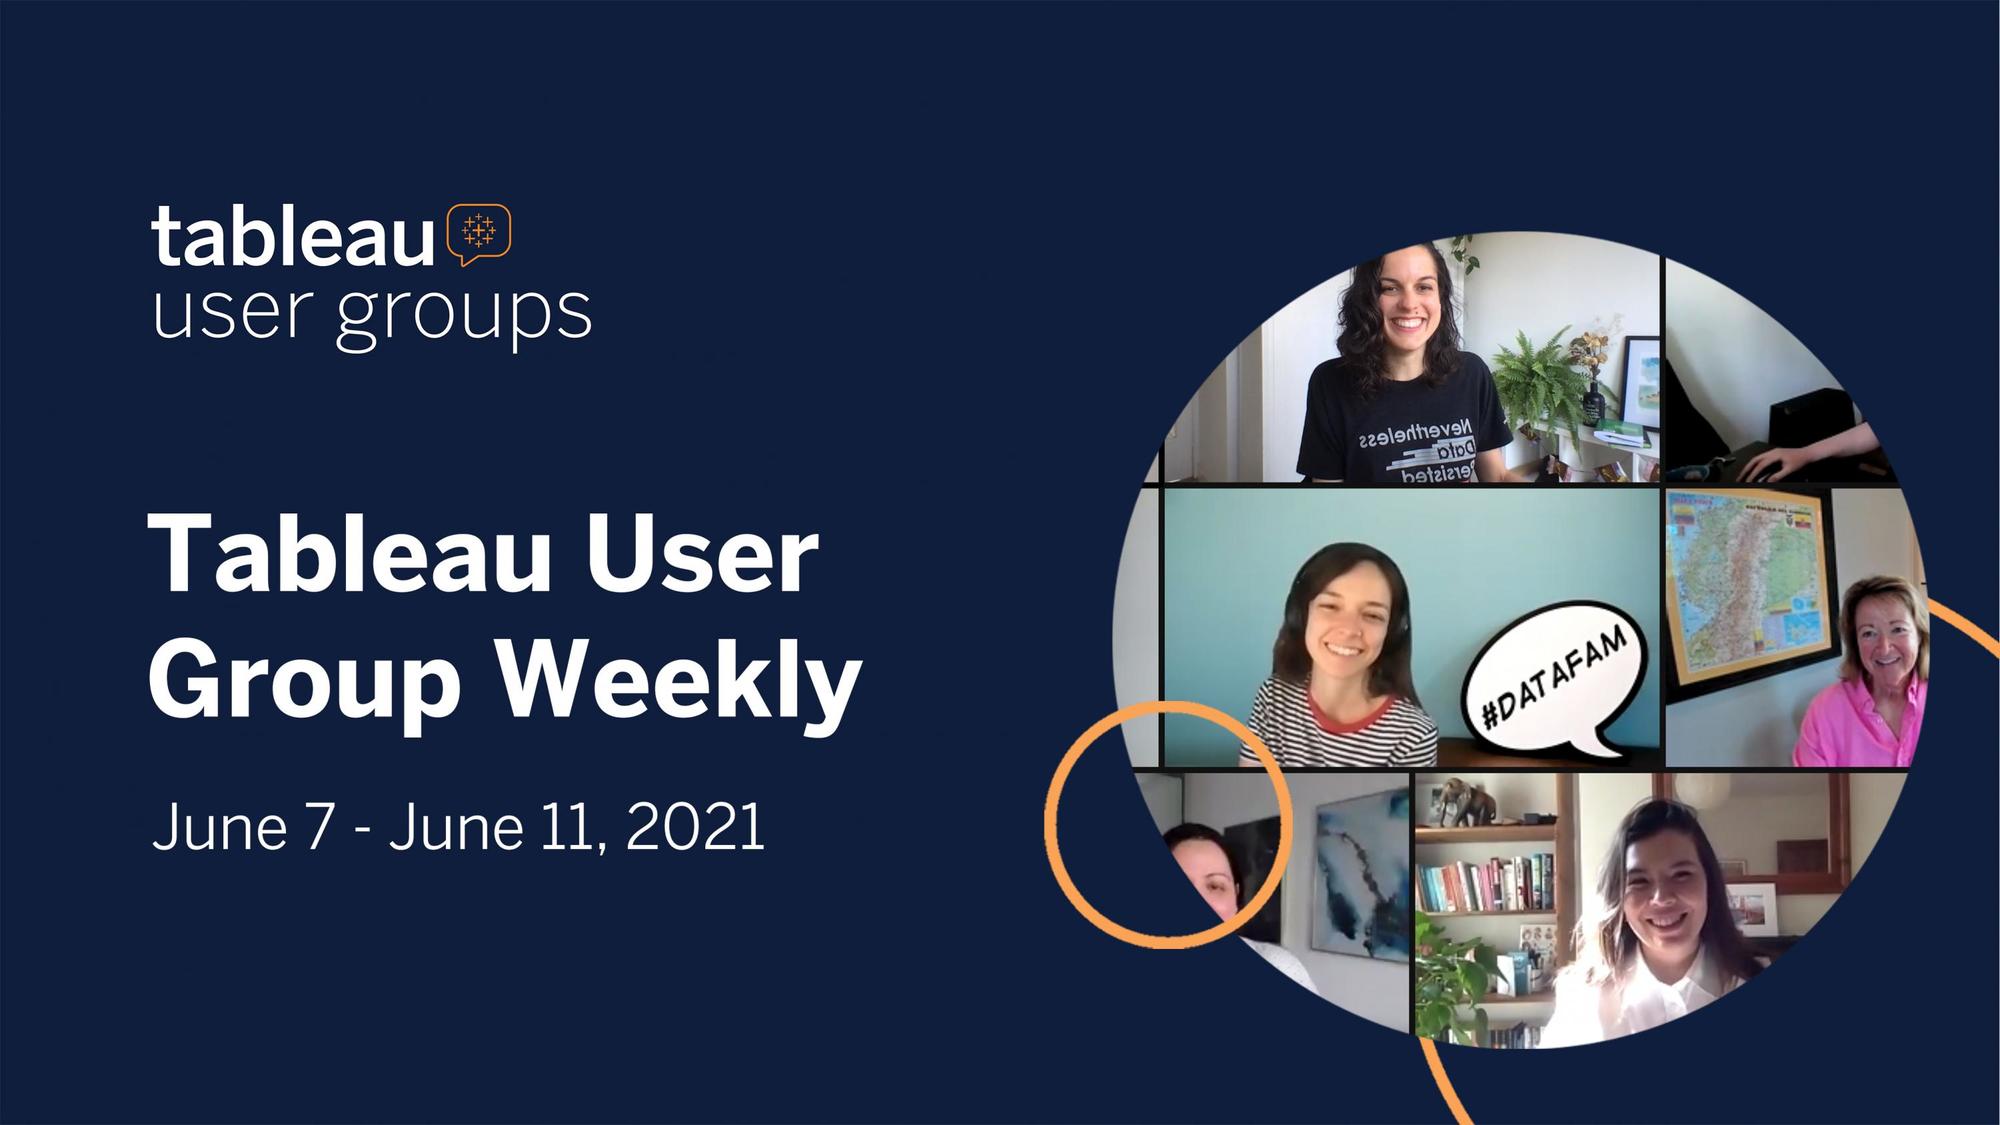
Tableau User Group Weekly: June 7 - June 11, 2021 featuring the Data + Women Global Meetup
Check out all the virtual Tableau User Group events here and catch up on this past week's Tableau User Group Weekly: June 7 - June 11, 2021—a new weekly blog series highlighting the latest Tableau User Group events around the world.
- Viz Feedback Office Hours Wednesdays Sign up to meet with Michelle Frayman and Zak Geis and discuss your content.
- June 18th A Cup of Data vol 2 - Data Prep Smart Transformations Workshop Join the second session of our Cup of Data series where we expand on your Tableau CRM skills. This time we are brewing a different type of session and giving you the opportunity to be hands-on in a virtual workshop.
- Data Visualization Competition | Women in Analytics The results are in! The fourth annual data visualization competition is back—check out the 2021 Top 10 Finalist Visualizations and vote for your favorite by July 4, 2021.
Vizzes
Catch this week’s Viz of the Days here and subscribe to get them emailed directly to your inbox.
Check out some inspirational vizzes created by the community:
- PRIDE Eve Thomas
- Rick and Morty Siddhanth Shetty
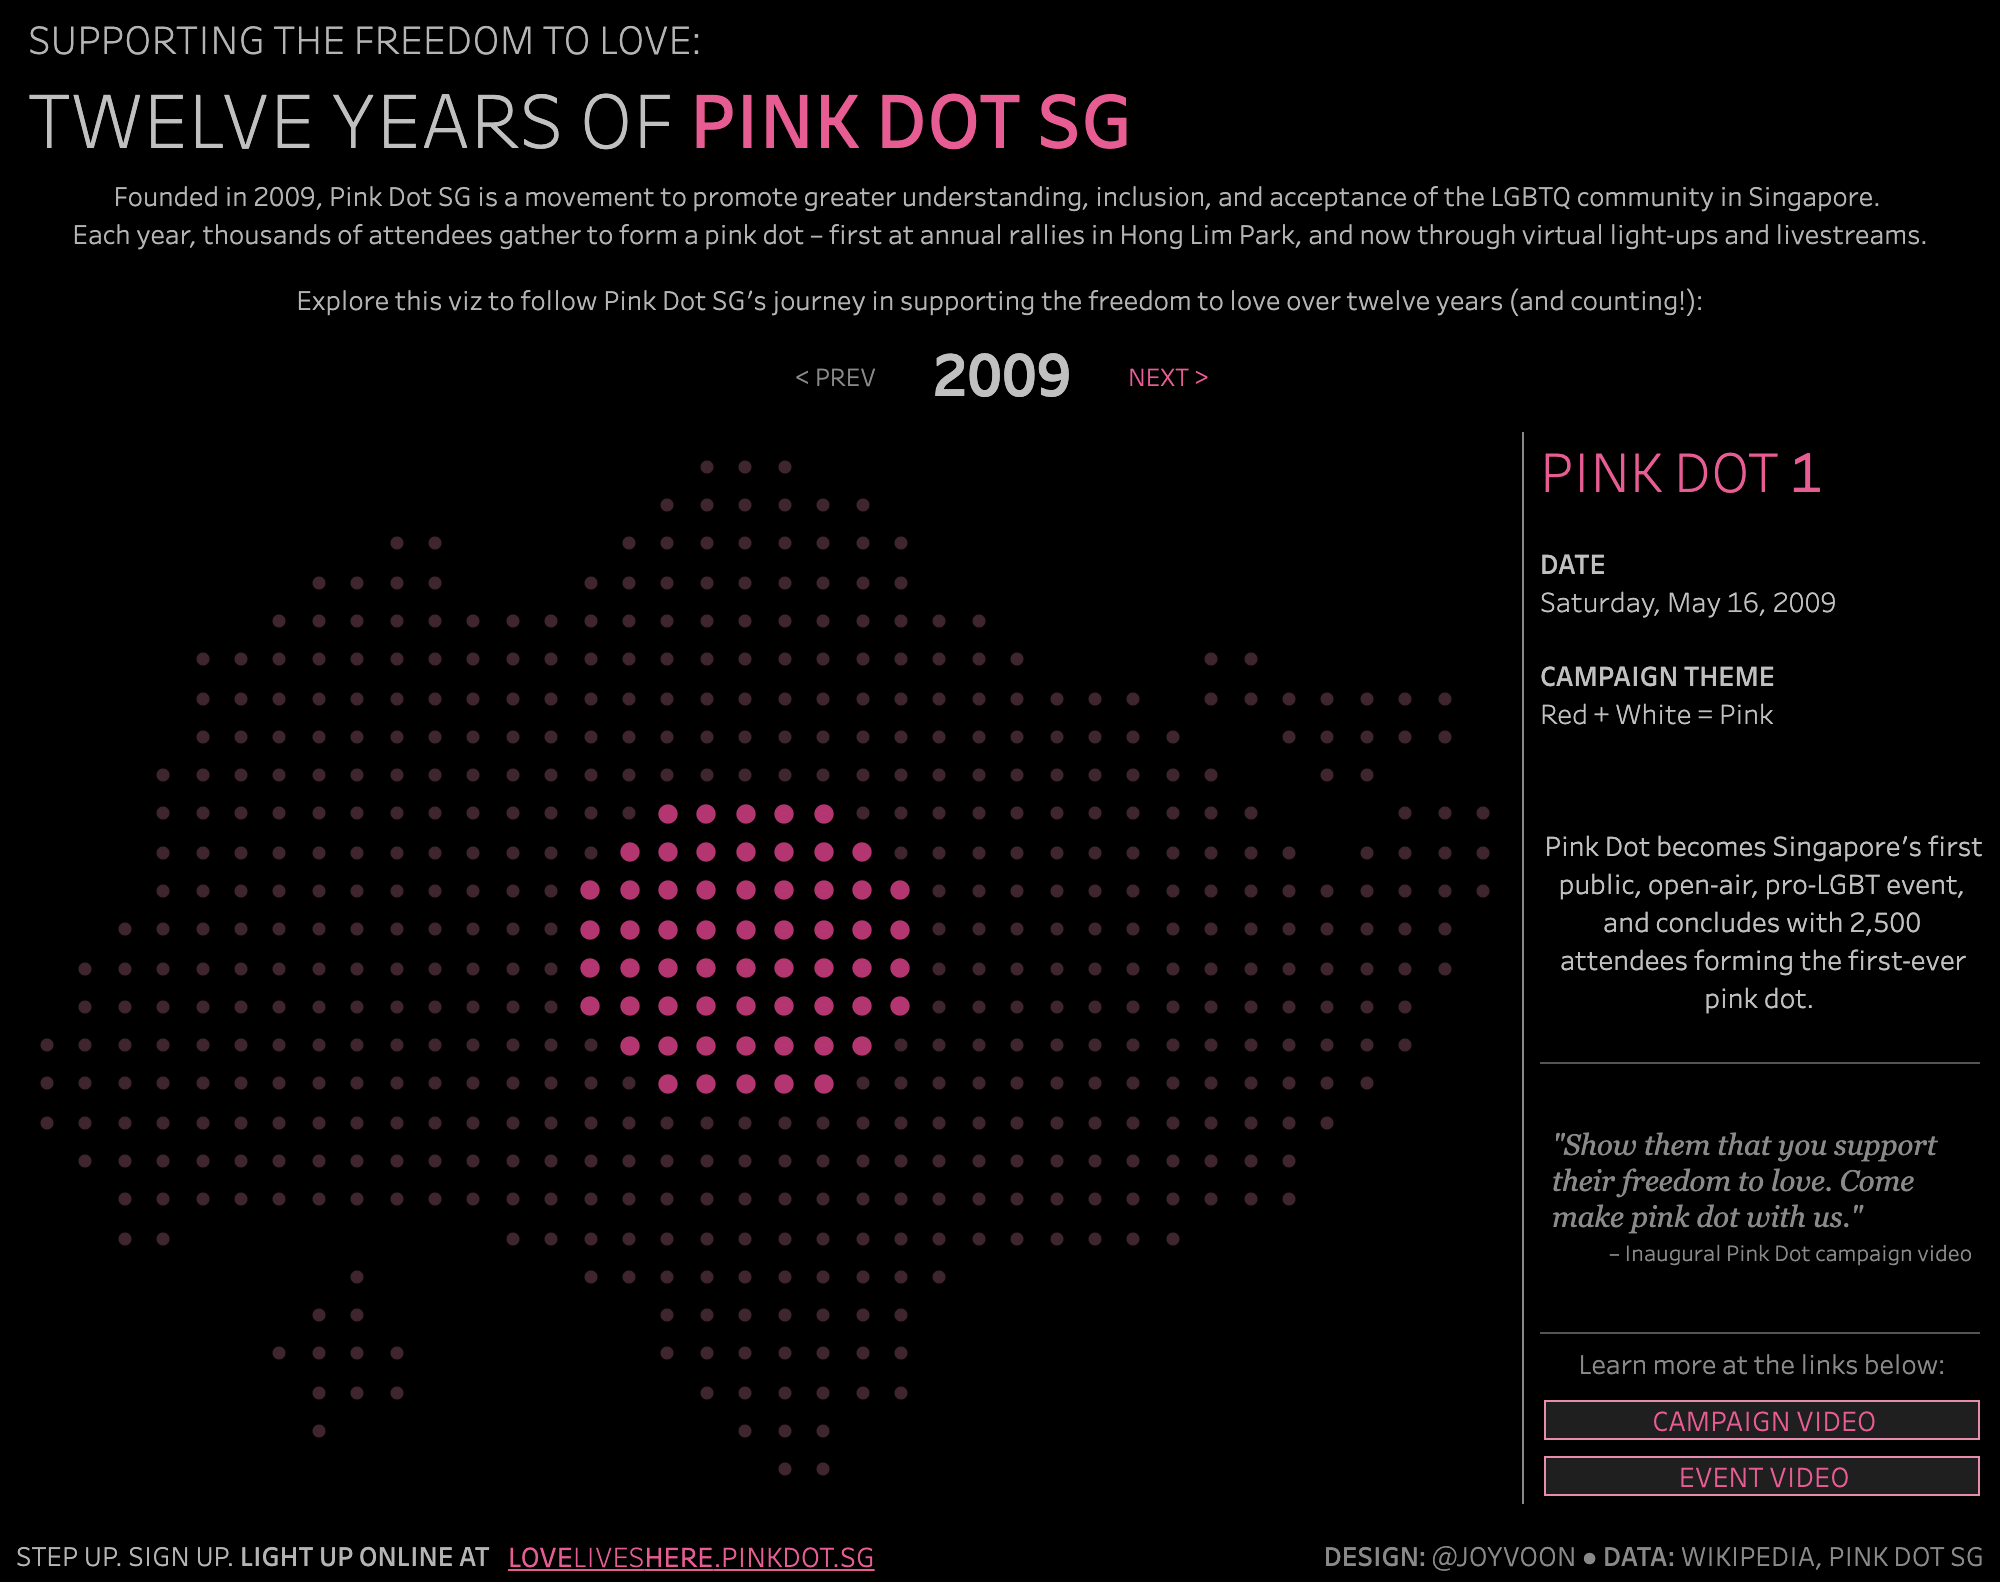
- Pink Dot Singapore: Twelve Years and Counting Joy Voon
-
Fantasy Premier League (FPL, Google Sheets) Jeff Komen
-
LGBT - Mental Health Saverio Rocchetti
-
Euro 2020 Squads Ryan Soares
Community Project Updates
Stay in the loop on the Tableau Community Projects

Verwante verhalen

DataFam Roundup: April 8–12, 2024
 12 april, 2024
DataFam Roundup: April 1–5, 2024
5 april, 2024
DataFam Roundup: March 25–29, 2024
29 maart, 2024
Subscribe to our blog
Ontvang de nieuwste updates van Tableau in je inbox.