DataFam Roundup: March 22-26, 2021


Welcome back and happy Friday! Dig into the latest DataFam Roundup—a weekly blog post that brings together what’s trending in the community all in one post. As always, we invite you to send us your content—and the DataFam content from your peers that have inspired you! Find the content submission form here.
DataFam blog content
Dive into content created by the Tableau Community:
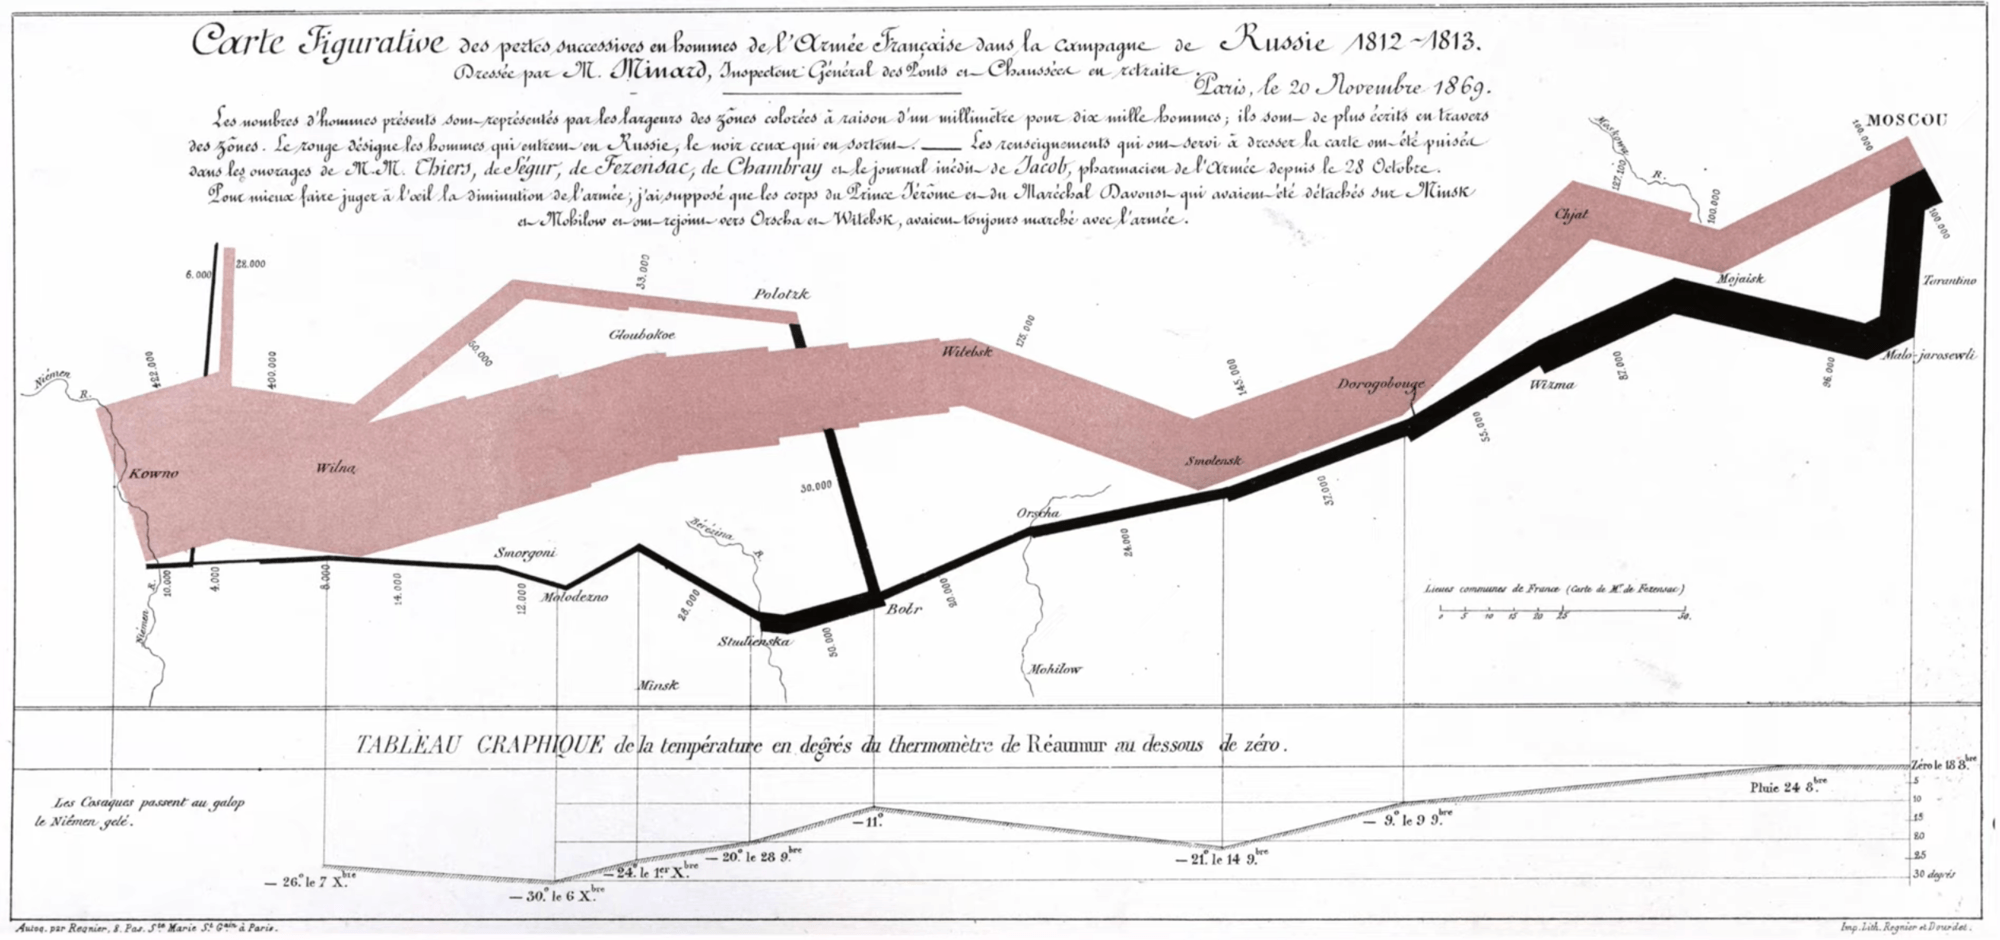
- Minard's Famous "Napoleon's March" Chart – What It Shows, What It Doesn't Robert Kosara
- An Interview with Alexander Varlamov (A Tableau Zen Master and Public Ambassador) Adam Mico
- An analysis and comparison of three powerful data analytics platforms: Tableau, TCRM and Datorama Alex Waleczek
- Creating dynamic drop menus in Tableau VizConnect
- New job, who dis? (and a lesson for your next career move) Joshua Smith
- Why are reports always seen as an afterthought? Matt Francis
- Filippo Mastroianni è il primo Tableau Zen Master italiano! Scopriamo chi è e come si costruisce una professione intorno ai dati Stefano Cassola (Italian)
Upcoming events

Data + Diversity: Bias in AI with Carol Reiley
Join an upcoming Tableau User Group event:
- March 31, 2021: Data + Women Special Climate Science
- March 31, 2021: NYC Tableau User Group: DataDev Edition
- April 26 2021: Analytics Tableau User Group
Check out all the virtual Tableau User Group events here.
March 30, 2021 Data + Diversity: Bias in AI with Carol Reiley: Join us as we go behind the scenes with entrepreneur, Artificial Intelligence roboticist and investor Carol Reiley to explore why the systems and designs fail in some applications and steps we can take collectively while working on these systems. We will discuss the current state of technology and share anecdotes as we embark on a new frontier for technology.
May 20, 2021 Tableau’s first DataDev Day: We’re excited to announce a new, one-day event dedicated to DataDevs and anyone interested in or using the Tableau developer platform to create integrations and customize Tableau for their organizations.
Summer, 2021 Data Book Club: If you're interested in reading a book about data and discussing it with others, sign up for the Data Book Club!
Vizzes
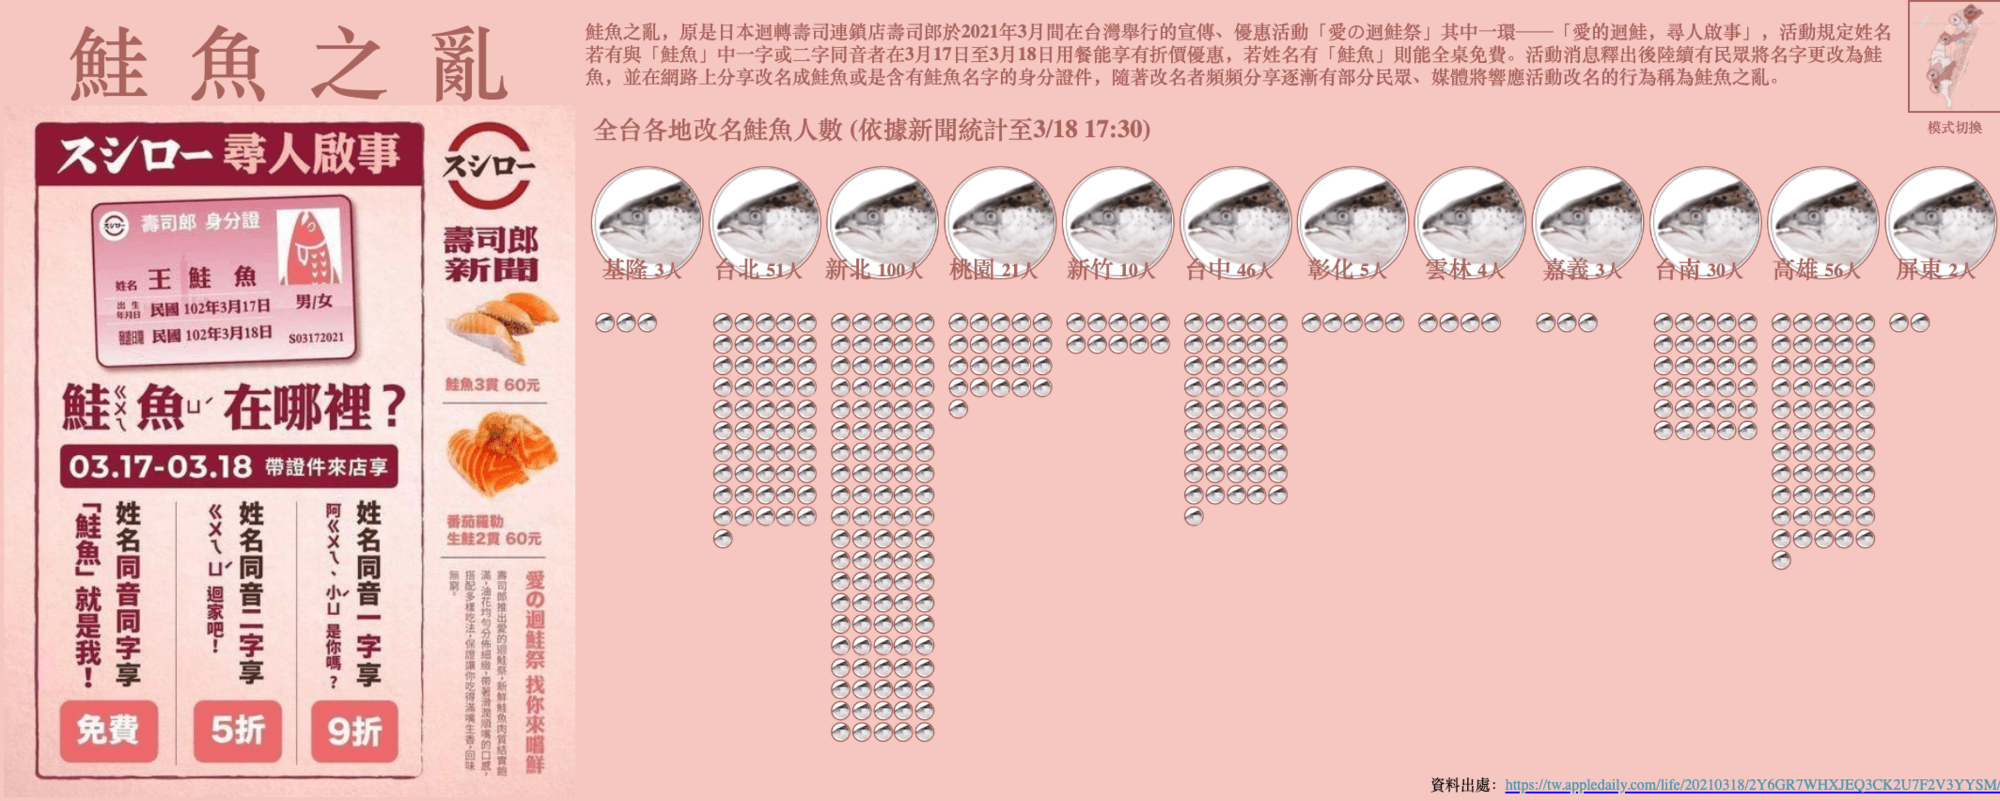
2021年 - 台灣鮭魚之亂 Bill Chen
Catch this week’s Viz of the Days here and subscribe to get them emailed directly to your inbox.
Check out some inspirational vizzes created by the community:
- 2021年 - 台灣鮭魚之亂 Bill Chen (陳克勤), some context: Last week, a Japanese company in Taiwan put out a promotion for people to eat for free or with a discount if they had the name “Salmon” in Chinese or a name that sounds close to it. This viz shows the number of people that changed their name to qualify for the discount. Each salmon head indicates a different city in Taiwan and the number of people from that area that changed their name.
- How MIXED is the MARTIAL ARTS in the UFC? Adedamola Ladipo
- Hospital Emergency Rooms Dashboard Joti Gautam
- Postgres Directory Ravi Mistry
Community Projects

Stay in the loop on the Tableau Community Projects:
Makeover Monday
Join the community every Monday to work with a given data set and create better, more effective visualizations.
Web: Makeover Monday
Twitter: #MakeoverMonday
Week 12: The Cereal Industry Had A Very Weird Year
Workout Wednesday
Build your skills with a weekly challenge to re-create an interactive data visualization.
Web: Workout Wednesday
Twitter: #WOW2021
Week 12: Can you do Comparative Quantity Analysis?
Sports Viz Sunday
Create and share data visualizations using rich, sports-themed data sets in a monthly challenge.
Web: Sports Viz Sunday
Twitter: #SportsVizSunday
March 2021: Adaptive Sports
Iron Quest
Practice data sourcing, preparation, and visualization skills in a themed monthly challenge.
Web: Iron Quest
Twitter: #IronQuest
March 2021: Games
Storytelling with Data
Practice data visualization and storytelling skills by participating in monthly challenges and exercises.
Web: Storytelling with Data
Twitter: #SWDChallenge
March 2021: March MAPness
Project Health Viz
Uncover new stories by visualizing healthcare data sets provided each month.
Web: Project Health Viz:
Twitter: #ProjectHealthViz
March 2021: Adaptive Sports
SDG Viz Project
Visualize data about Sustainable Development Goals provided by the World Health Organization.
Web: SDG Viz Project
Twitter: #TheSDGVizProject
March 2021: Goal 14- Life Below Water
Preppin' Data
A weekly challenge to help you learn to prepare data and use Tableau Prep.
Web: Preppin’ Data
Twitter: #PreppinData
2021 Week 10: Maldives Tourism
Real World Fake Data
Create business dashboards using provided data sets for various industries and departments.
Web: Real World Fake Data
Twitter: #RWFD
Dataset #7: Retail
Viz 2 Educate
Each month, create vizzes on global education syllabus topics as resources for teachers worldwide.
Web: Viz 2 Educate
Twitter: #Viz2educate
February: History
Viz for Social Good
Volunteer to design data visualizations that help nonprofits harness the power of data for social change.
Web: Viz for Social Good
Twitter: #VizforSocialGood
Feb 20, 2021-Mar 14, 2021: Vera Aqua Vera Vita
Diversity in Data
An initiative centered around diversity, equity & awareness by visualizing provided datasets each month.
Web: Diversity in Data
Twitter: #DiversityinData
March 2021: Adaptive Sports
Verwante verhalen

DataFam Roundup: April 8–12, 2024
 12 april, 2024
DataFam Roundup: April 1–5, 2024
5 april, 2024
DataFam Roundup: March 25–29, 2024
29 maart, 2024
Subscribe to our blog
Ontvang de nieuwste updates van Tableau in je inbox.