Tableau Community Celebrates the Impact of Makeover Monday


For anyone not familiar with Makeover Monday, let me explain it in two words: It’s awesome. It began with a simple email and a social data experiment to see how different people would interpret the same data set. The goal was to feature a weekly chart or graph and a data set that community members could reimagine to make it more effective.
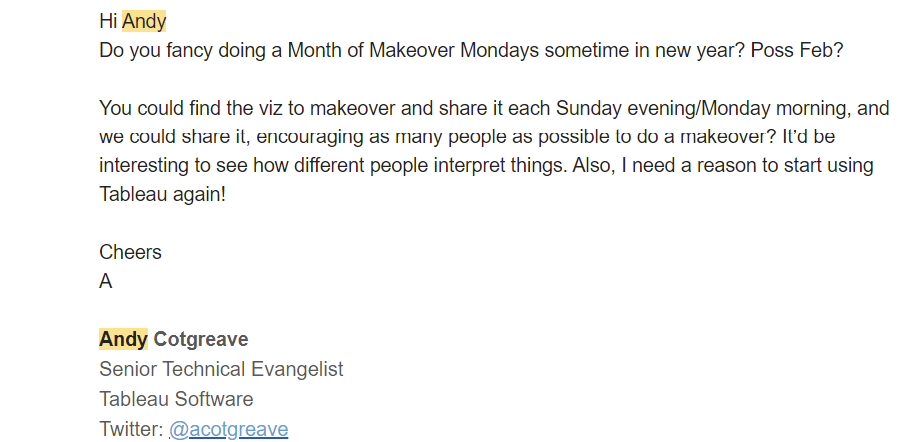
I found the first email I sent to Andy Kriebel from November 13, 2015, about turning it into a thing. Before this, he'd been doing makeovers on his blog for several years, but I suggested we try it out together for a while. Who knew this email would trigger so much?
Hosted by Andy Kriebel and Eva Murray, it became an inspiration for the data viz community to learn and improve their data skills. Each Sunday, the team posted a link to a chart and data set. The challenge was to create a better version of the visualization in your own creative way—to either find a way to tell the data story more effectively or to discover something new in the data.
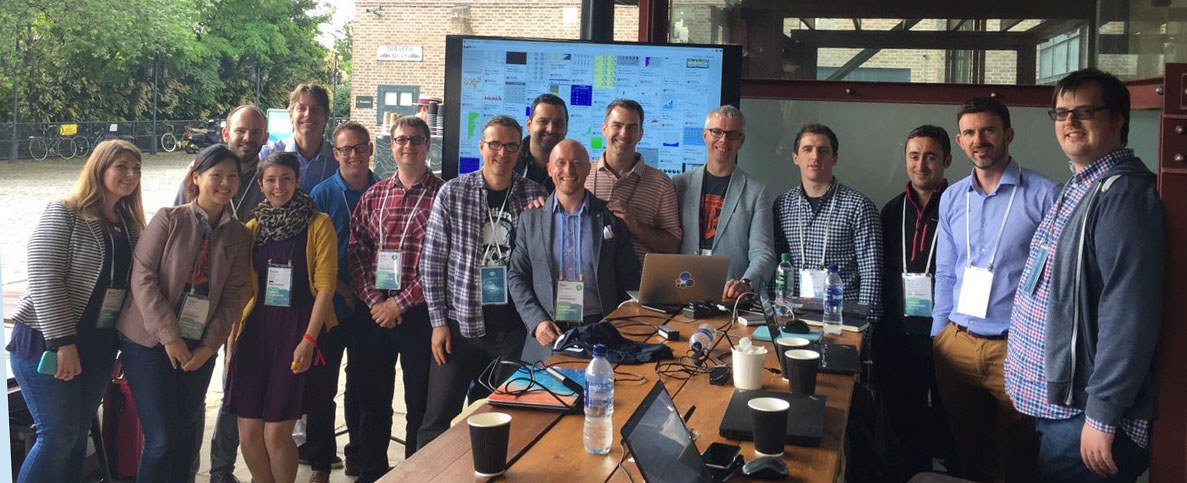
Andy Kriebel and I during our first-ever live Makeover Monday at Tableau Conference in 2016. Read all about it here.
The results of this project have been astounding: When you search #MakeoverMonday on Tableau Public, you’ll see over 10,000 vizzes—perfectly illustrating the highly variable nature of data visualization. In September, Andy Kriebel shared that Makeover Monday was going on an indefinite hiatus. While there will be no new weekly data sets and walkthrough visualization sessions, the influence of this community project continues (just take a look at all the comments on Andy’s tweet). We asked a few Tableau Community Leaders to reflect on the impact it has had on them.
#MakeoverMonday Week 39 is week 300. After this week, MM is going on an indefinite hiatus.
— Andy Kriebel (@VizWizBI) September 27, 2021
For this week, we go back to my viz from week 1. Get the data here - https://t.co/3X0AFUJOjU
Thank you @TriMyData @CharlieHTableau @acotgreave for their help through the years. pic.twitter.com/ycO9cydQSo
Where were you then, where are you now, and how did Makeover Monday help you along the way?
Priya Padham: I have participated in Makeover Monday since I first discovered Tableau in March 2020 after a recruiter told me about the software. I wanted to learn Tableau and visualization best practices and get involved with #MMVizReview to get feedback to continue improving and preparing for my application to The Data School.
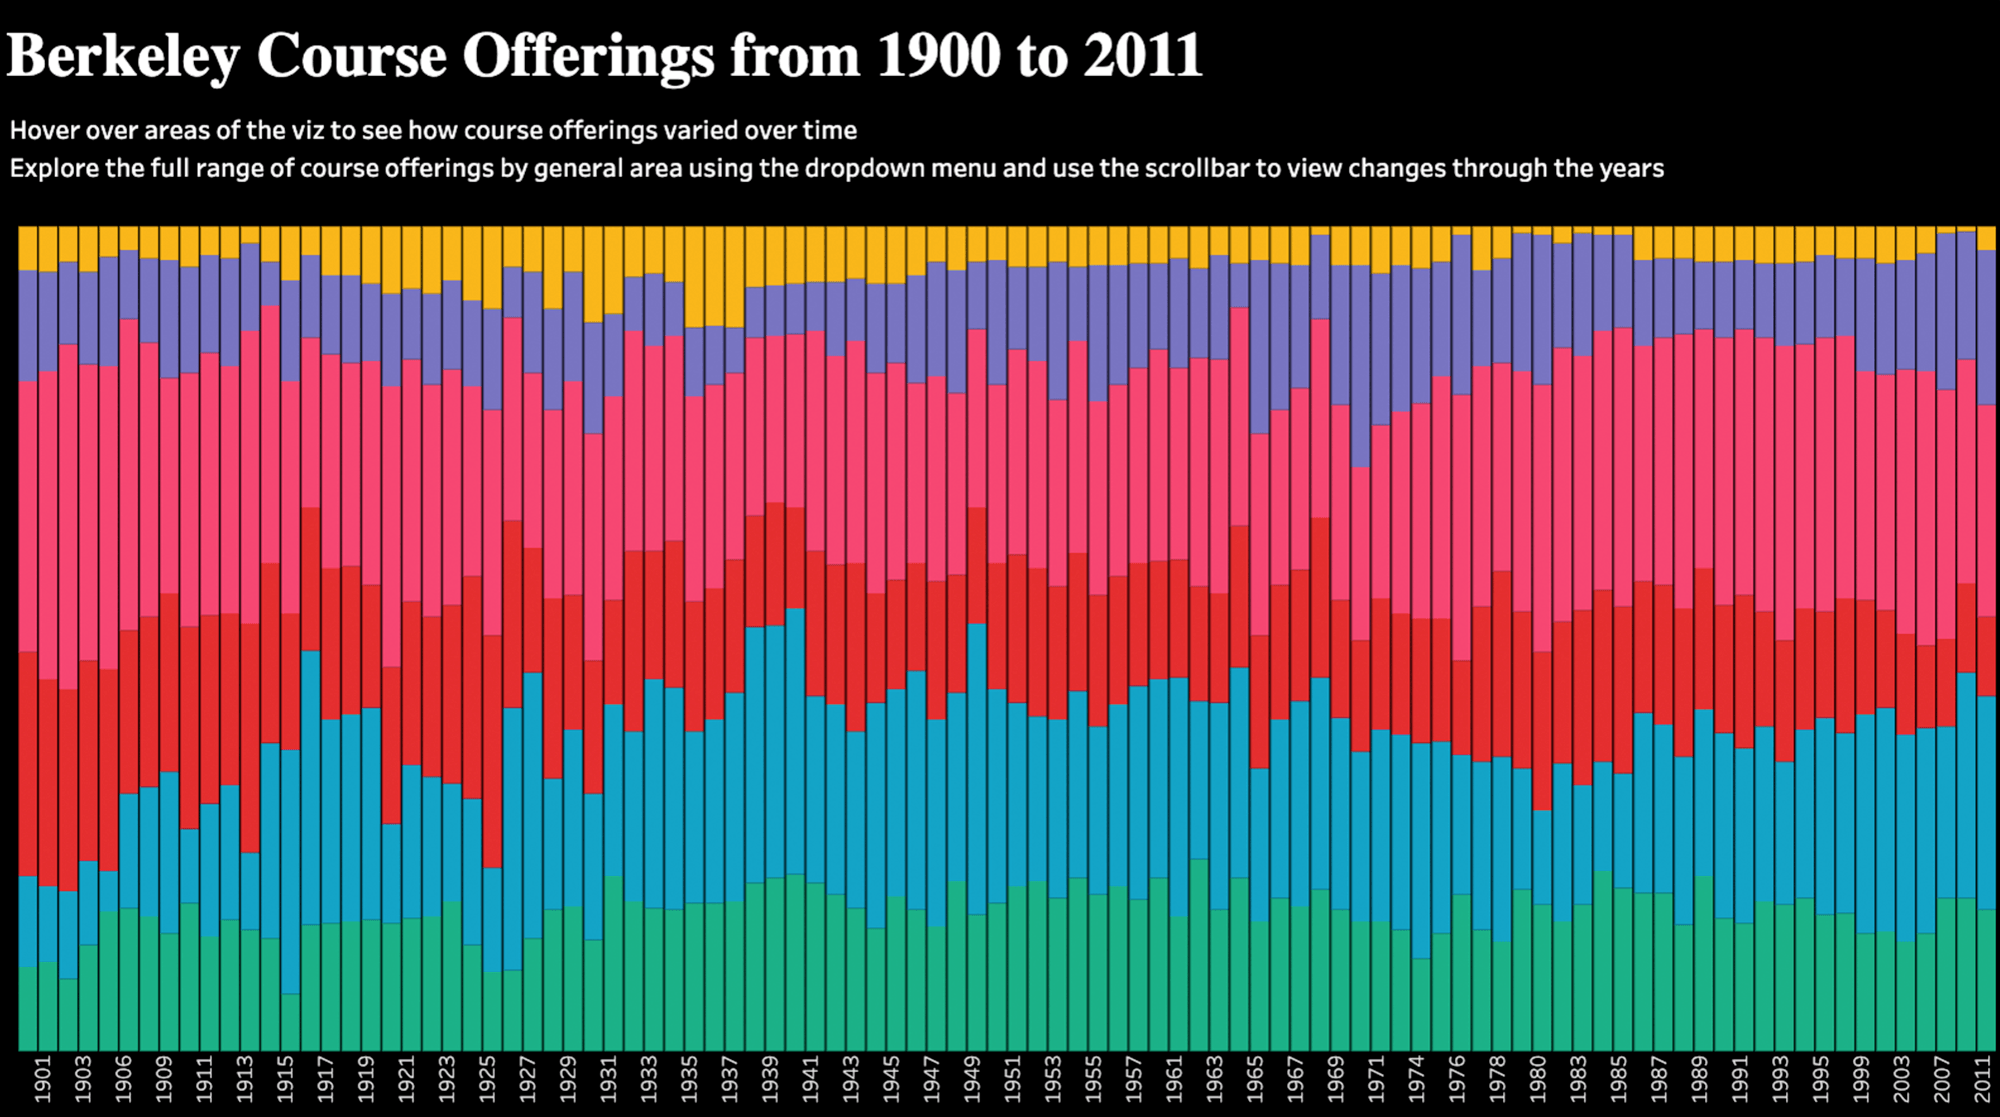
Priya Padham’s first Makeover Monday visualization on Berkeley Course Offerings.
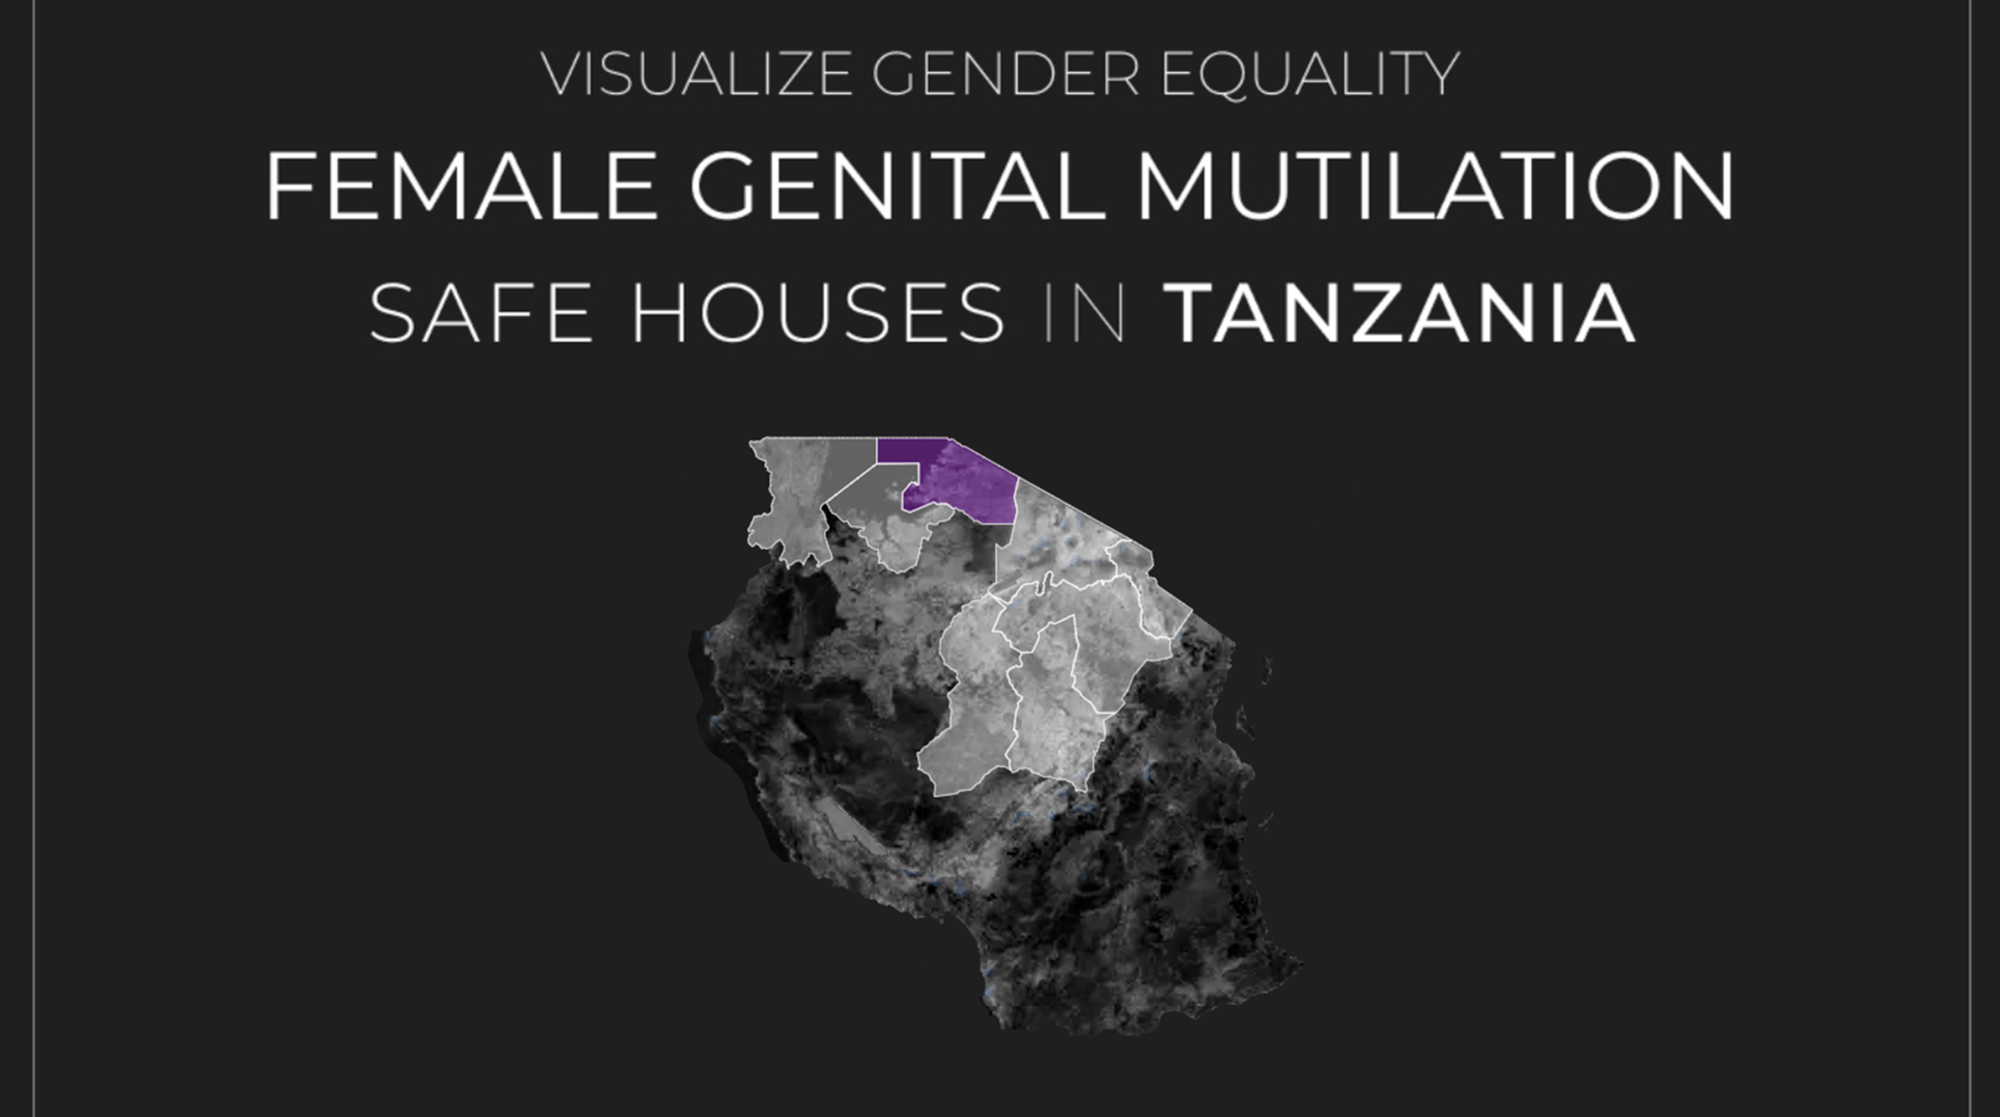
Priya Padham’s Makeover Monday submission last updated on April 7, 2021: Safe Houses in Tanzania
When I first began, I was a complete Tableau beginner. My first submission was on Berkeley Course Offerings. I continued to learn along the way with every week and each viz I created. The viz that shows the most progress I’ve made is Safe Houses in Tanzania. Because of Makeover Monday and the feedback that I received from Eva Murray and Charlie Hutcheson, I went from not knowing anything about data visualization and Tableau to starting my career at The Data School. This initiative completely changed my life and helped me build my skills and meet so many amazing community members who took part every week.
Anastasiia (Asia) Komissarova: I have participated for 20+ weeks. I decided to try it out as an additional challenge to develop my skills and connect with others working with the same technology. It’s been a free space to experiment and get feedback. Thanks to my portfolio made with the help of Makeover Monday, I got a new job, which I love. As a result, I understand that the only limitation to my progress is me.
Participating in Makeover Monday helped me improve my design, analysis, and storytelling. I loved being part of the Tableau Community and getting to know people through regular practice and viz review.
Michelle Frayman: I have participated in Makeover Monday since November 2018 to improve my data visualization skills. I had been building visualizations for many years at work, but I was not satisfied with how they looked or the information they conveyed/stories they were telling. Participating in Makeover Monday helped me improve my design, analysis, and storytelling. I loved being part of the Tableau Community and getting to know people through regular practice and viz review.
Yomisola Adegeye: I started participating in Makeover Monday over a year ago. It was an opportunity to improve my analytical skills. When I started, I was pretty new in the field, I had only done an internship, and I wanted to grow. The whole of my profile speaks to my progress as I got better throughout the process of every project.
Agata Ketterick: My very first Makeover Monday submission was November 2019, and then I participated every week throughout 2020. After attending my first Tableau Conference in 2019, I was so energized and excited that I made a long list of data viz and Tableau goals I wanted to accomplish on the plane home. One of those goals was getting "better" at data viz, which is pretty vague but is what initially led me to Makeover Monday.
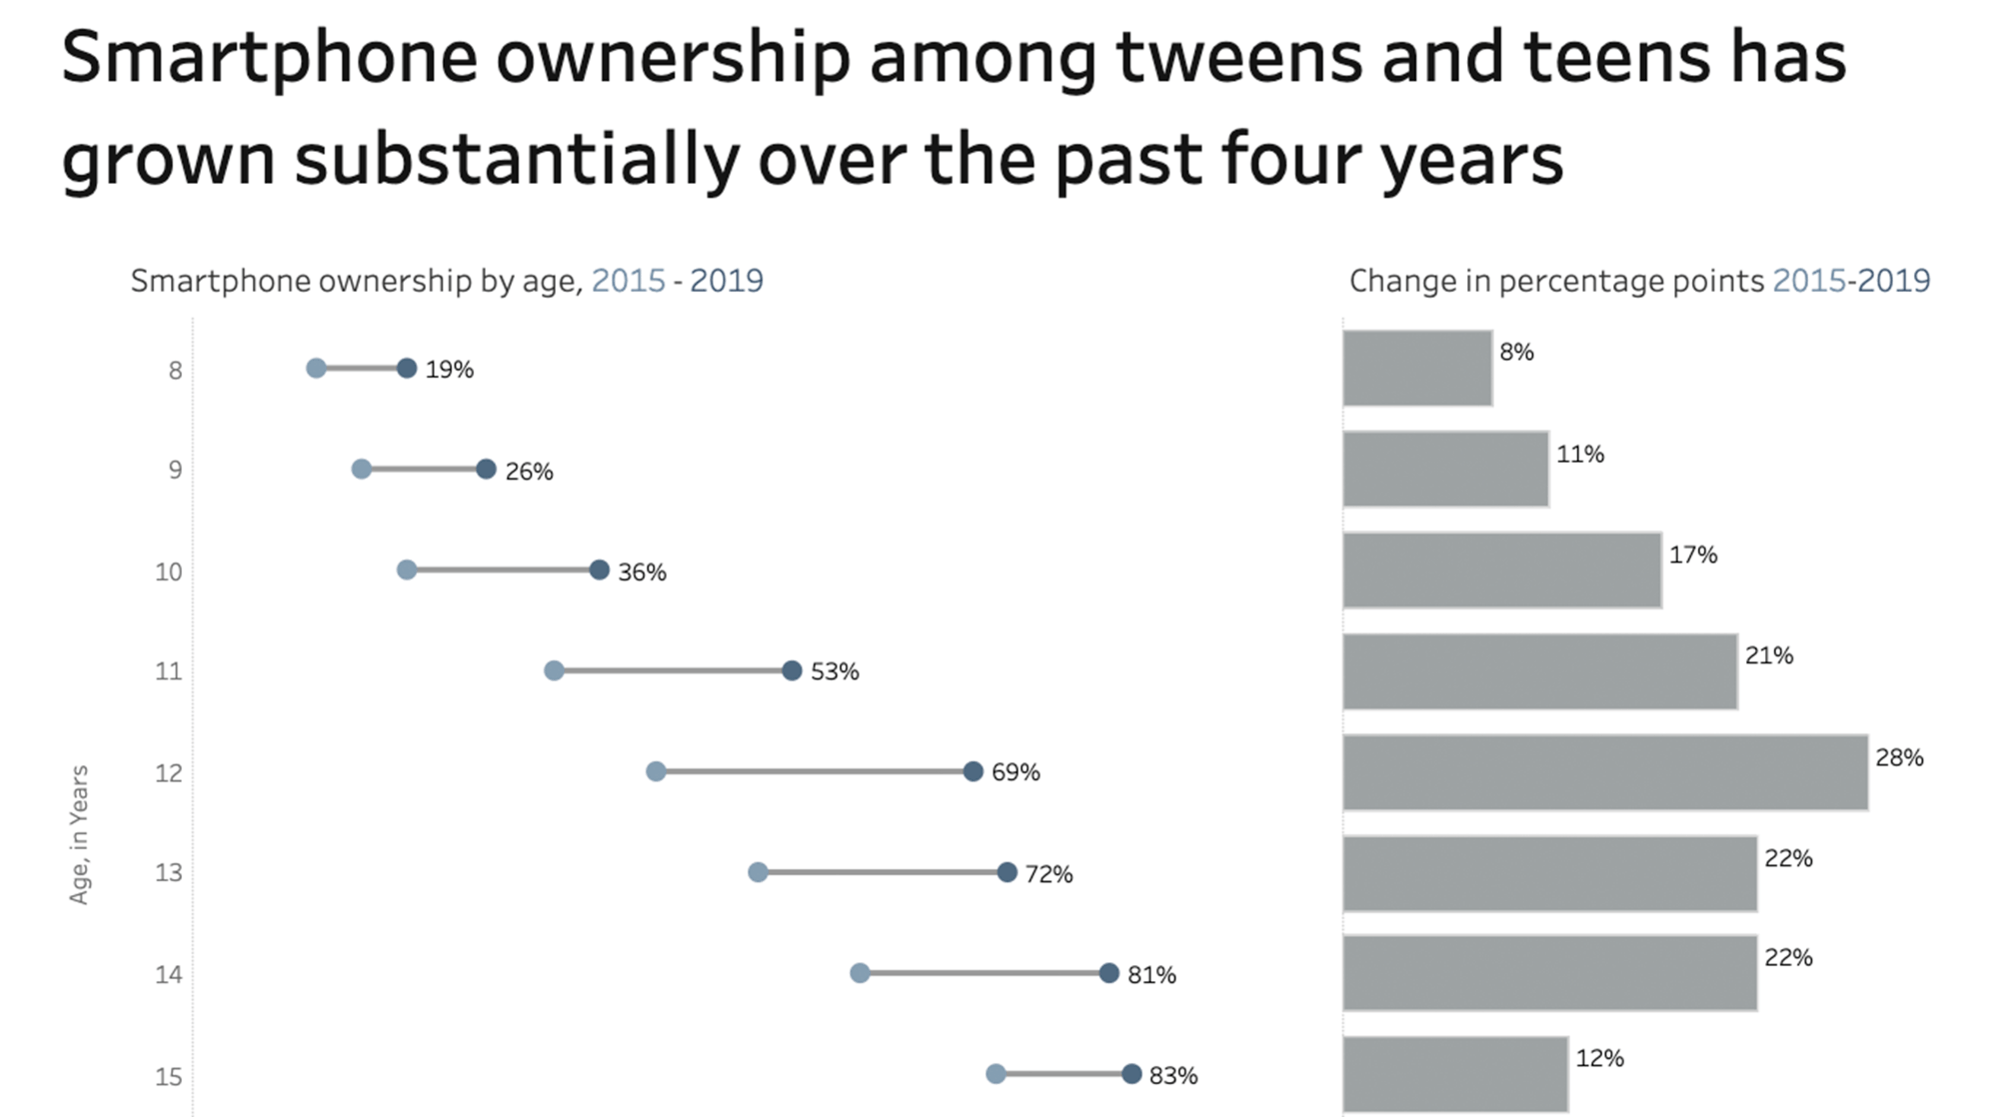
One of Agata Ketterick’s early Makeover Monday submissions, Smartphone Ownership Among Teens
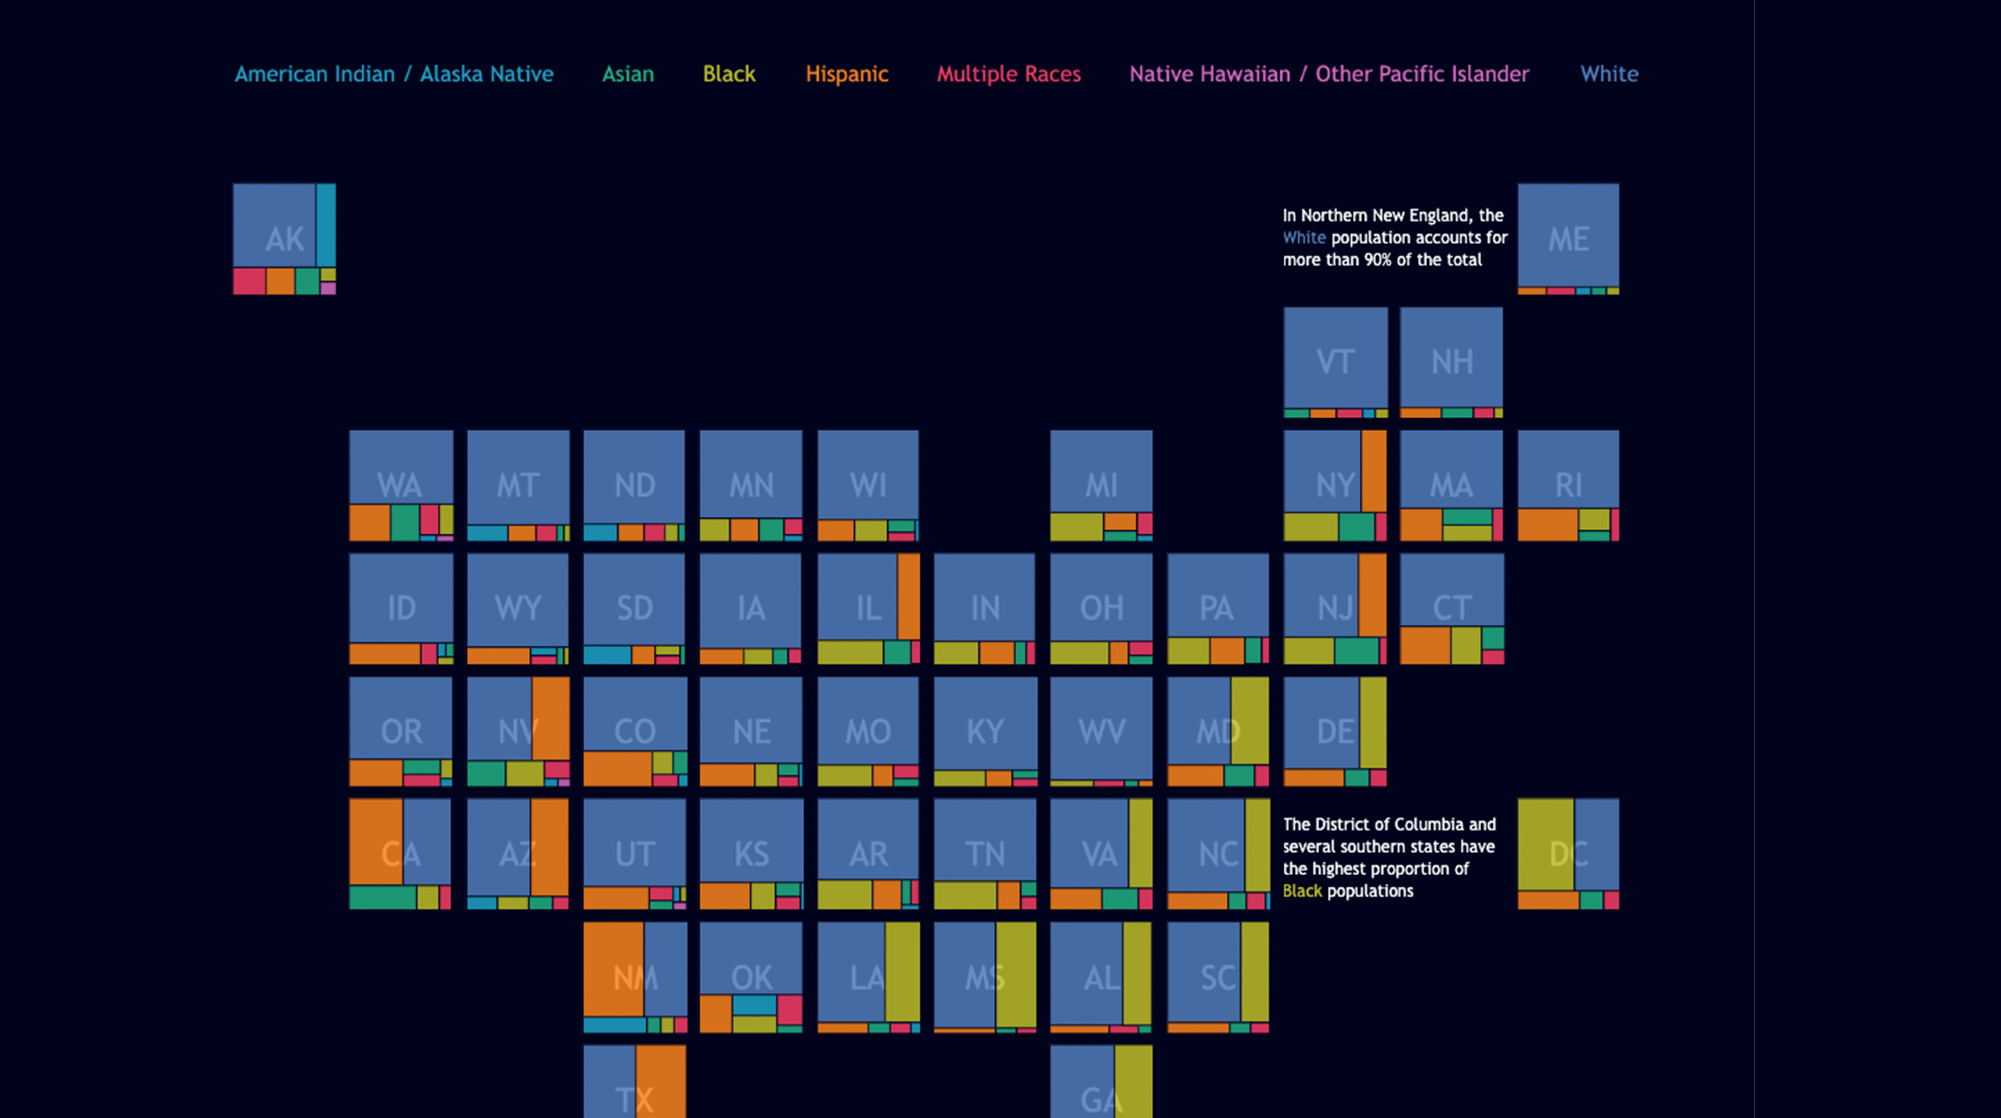
Agata Ketterick’s Makeover Monday submission, How diverse is your state? last updated in July 2021.
At the time, I was working as a research analyst at the University of New England, and while I was using Tableau, it was in a really limited way. Basically, I created a chart, exported the image, and inserted it into PowerPoint. I'm now a Data Visualization Consultant at Lovelytics, a Tableau Public Ambassador, and five of my vizzes have been Viz of the Day. I don't think I'd be where I am if it wasn't for Makeover Monday. The project provided a space for me to practice consistently. Eva Murray and Charlie Hutcheson provided helpful feedback every week. Participating in the project introduced me to the DataFam and the incredible work produced by the Tableau Community. Here are some of my earliest submissions: Smartphone Ownership Among Teens and America's Favorite Sports to Watch. When looking at my most recent vizzes, you can see my growth: Cost of Mobile Data and How diverse is your state?
What is your favorite Makeover Monday viz and your greatest learnings from it?
Priya Padham: My favorite Makeover Monday visualization that helped shape how I thought about design when I first started was Domestic Female Violence is A Global Problem. I remember seeing this visualization and being in awe of how it was carefully structured to raise awareness, the graphics used, color, spacing —everything. It opened my eyes to what is possible and made me want to learn more.
Anastasiia (Asia) Komissarova: I can't choose just one. With Makeover Monday, I met many great creatives and analysts from whose work I learned a lot. With every new challenge, I tried to learn something new: a new chart type, a new design tool, a new layout, etc.
Michelle Frayman: I actually have two favorites from the same week of Makeover Monday: MMDragonStuff and #GOT and The Women of Ice and Fire. One of the greatest things I learned from them is that there are many ways to visualize the same data. You don't need to use all the data, and visualizations can be informative and beautiful or simple and direct.
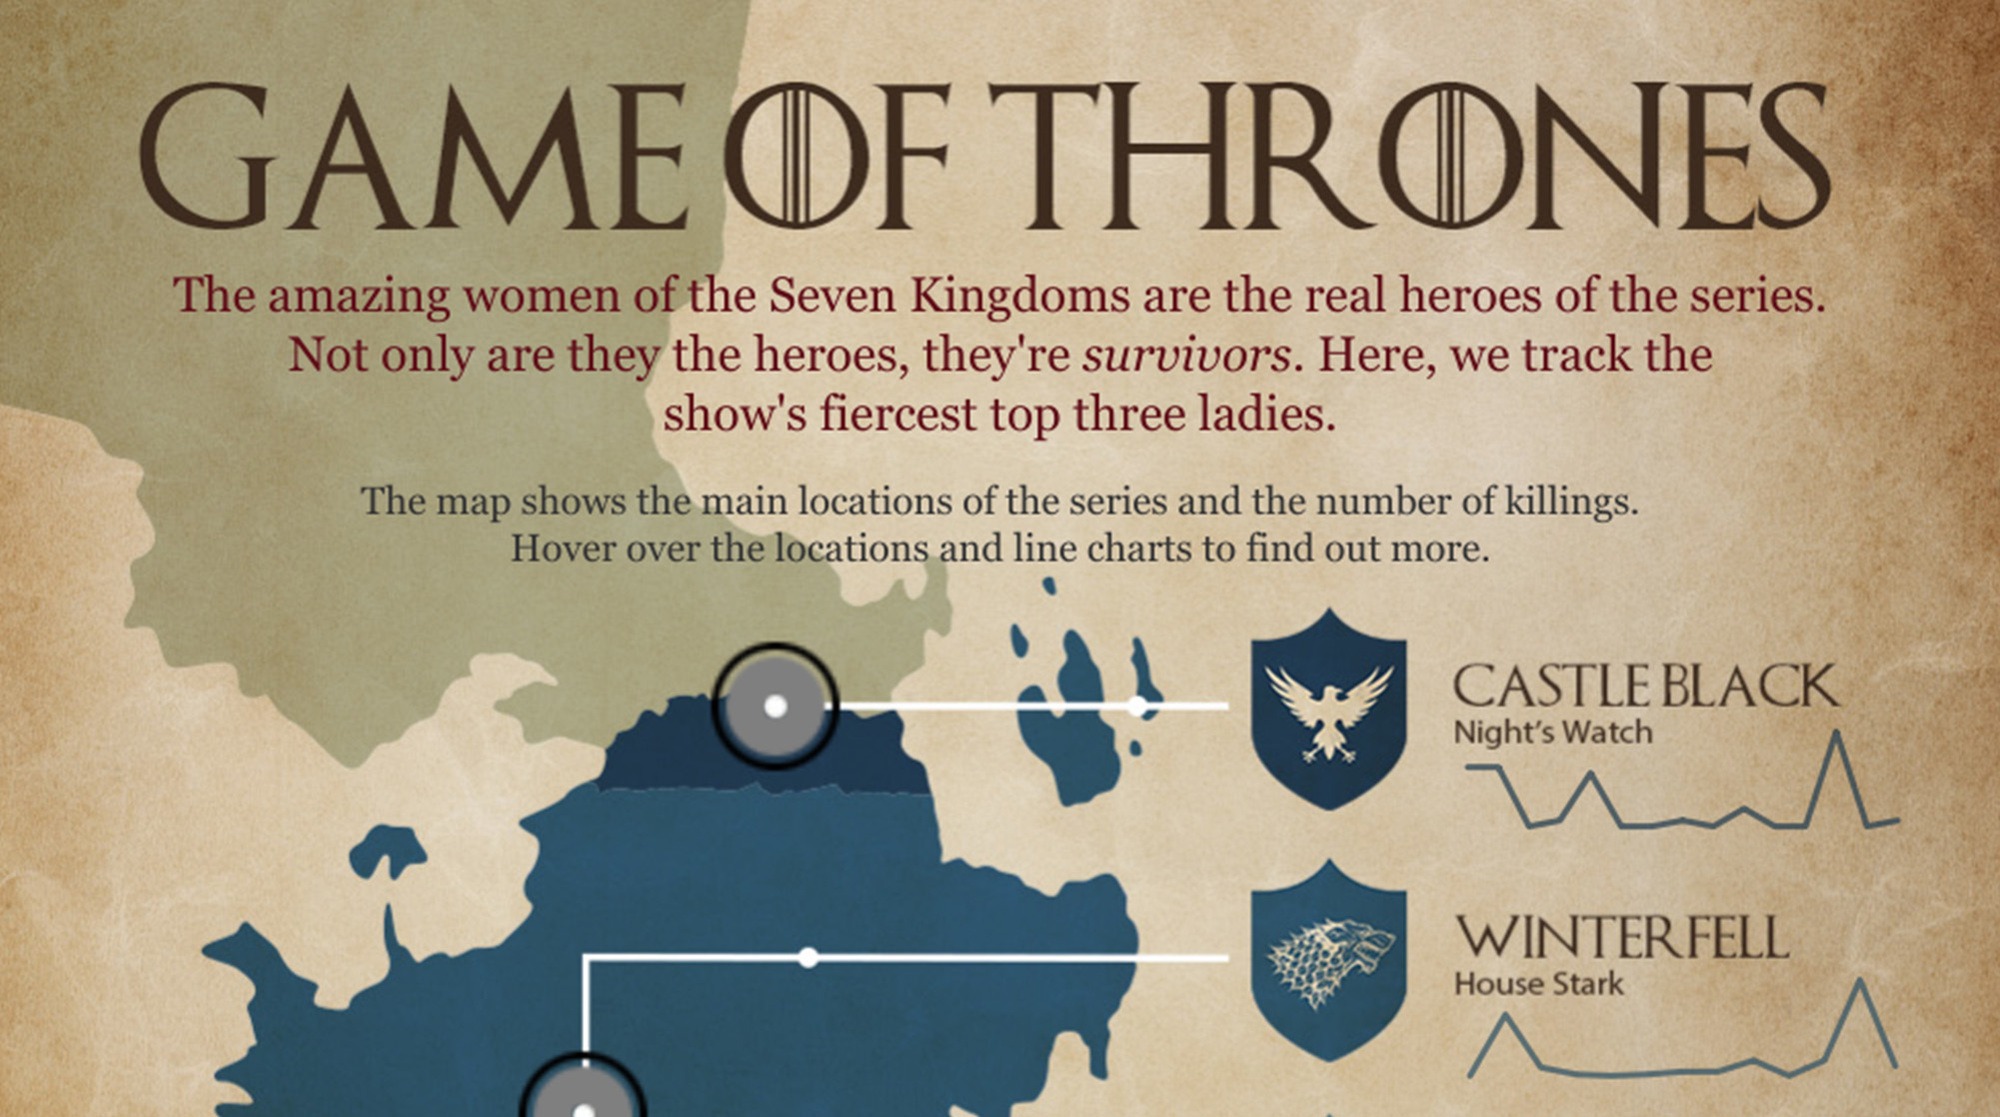
One of Michelle Frayman’s favorite vizzes on Tableau Public: #GOT and The Women of Ice and Fire by Pablo Gomez.
Yomisola Adegeye: I have a lot of vizzes I love. I cannot pick a favorite because I have learned from every viz I have seen, which is either what to do or not to do.
Agata Ketterick: I loved working on all the Operation Fistula vizzes. Operation Fistula, a non-profit organization (NGO) working to end obstetric fistula for every woman, everywhere, launched a project called Visualize Gender Equality, together with the Tableau Foundation and #MakeoverMonday. Once a month, Operation Fistula provided a data set on different thematic areas of gender inequality. Working on these data sets, like Violence Against Women, was much more stressful than, say, visualizing the best breakfast cereal. But I felt like we were participating in something meaningful and hopefully making a difference.
Who in the Makeover Monday community has impacted you, and why?
Priya Padham: Judit Bekker shaped how many of us see design and inspired us to try different things in Tableau with her use of images, fonts, and unique take on the different datasets.
Anastasiia (Asia) Komissarova: Again, very hard to choose as I got support along my way from so many people. But if I must choose some names, I'd say Kevin and Ken Flerlage and Toan Hong for their endless learning materials, especially for beginners. Chimdi Nwosu for his creative visualizations. Wendy Shijia for geospatial analysis and design. And Adedamola (Damola) Ladipo for laconic design.
Michelle Frayman: Eva Murray has made a huge impact on me. She provided me the most feedback, gave me the opportunity to do a webinar on my first year of Makeover Mondays, and became a dear friend. I owe Eva a great deal of my improvement and am grateful for all the time she put into Makeover Monday helping the community.
Yomisola Adegeye: Andy Kriebel taught me concepts. Zainab Ayodimeji taught me design, organization, and alignment. And Abisola Oni mentored and encouraged me.
Agata Ketterick: It's hard to pick one person, but when I first logged into Twitter and started sharing my Makeover Monday submissions, I felt like I was just tweeting into space. Eventually, people began noticing, interacting, and sharing encouragement. One of those people was Michelle Frayman. Michelle was also completing every Makeover Monday, and we ended up chatting nearly every week, sharing our submissions, and asking each other for feedback. It was so nice not to be tackling this year-long project on my own and to have someone to share ideas with. Thanks for being awesome, Michelle!
What tips do you have for someone just starting to tackle the 300 Makeover Monday datasets?
Priya Padham: Keep all of your visualizations visible on your Tableau Public profile, especially the ones in the beginning. By doing this, you and everyone else viewing your profile can see your progress and growth with every viz you create.
Anastasiia (Asia) Komissarova: Be curious and experiment as much as possible. Experiment with charts, your analysis approach, UX, graphics, and design. Don't worry if at the beginning your visualizations are not as good as you expected, keep going and concentrate on your work and progress.
Michelle Frayman: Just do it! Seriously though, it can be intimidating to put your work out there. I had a lot of trouble doing that at first, but the community is there to cheer you on and help you when you need it. It is so rewarding and has made a huge difference for me professionally and personally.
Yomisola Adegeye: Just start, be consistent, do some research, and ask for help.
Agata Ketterick: Seek feedback. Practice helps, but feedback really enables you to understand what could be better.
Who do you think is a Makeover Monday rockstar, and why?
Priya Padham: Takafumi Shukuya posts new and original ideas for Makeover Monday every week and wants to keep it alive by encouraging others to join in by going back in time through the archives and working on past datasets. He is a truly amazing community member who is extremely consistent, dedicated, and cares about this initiative.
Anastasiia (Asia) Komissarova: Andy Kriebel for knowledge, consistency, and support.
Michelle Frayman: Everyone who participates is a rockstar, but the immediate two who come to mind are Luigi Cicciari and Agata Ketterick. Luigi has been quietly participating for years and has grown tremendously. Agata and I became friends via Makeover Monday, and I love her design work.
Yomisola Adegeye: I believe a Makeover Monday rockstar is someone who has poured their heart into the project, who has been consistent with not just creating a viz with the data but who always put every feedback received into action.
Agata Ketterick: Andy Kriebel and Eva Murray are rockstars for dedicating so much time to this project and helping so many individuals throughout the world improve their data visualization skills.
Get involved!
Makeover Monday has been transformative for thousands of Tableau Community members across the globe. Although it’s currently on an indefinite hiatus, it remains an opportunity for people to share and learn with each other while improving their analytics and data storytelling expertise. And it is the gift that keeps on giving. With 300 data sets and other related resources, the DataFam can continue to grow their visualization skills. Here’s how:
- Download any of the 300 datasets on the Makeover Monday website
- Visualize the data with Tableau Public and upload it to your Tableau Public profile. (If you don’t have an account, it’s free to sign up and download the app to analyze—just like the name implies—public data.)
- Request feedback from the Tableau Community using #DataFam and #MakeoverMonday.
To discover all the Tableau Community run projects, click here. Lastly, a special shout out to the three brand new community projects that have launched since September 2021:
- Back 2 Viz Basics: A bi-weekly project helping those who are newer in the community and just starting with Tableau—not limited just to newbies! Find the project on Twitter using #B2VB.
- Data Plus Music: A monthly project with a different challenge, topic, and/or dataset to explore focusing on all things music. Find the project on Twitter using #DataPlusMusic.
- Games Night Viz: This is a monthly project focusing on using data from your favorite games. Find the project on Twitter using #GamesNightViz.
Verwante verhalen
DataFam Roundup: April 15–19, 2024
 19 april, 2024

Meet Iron Viz 2024 Finalist Jessica Moon
 15 april, 2024

DataFam Roundup: April 8–12, 2024
12 april, 2024
Subscribe to our blog
Ontvang de nieuwste updates van Tableau in je inbox.