Tableau Public x International Community: How data viz enthusiasts from all over the world got their work in front of heads of state


Looking back at the year 2017, many exciting things happened in the Tableau Public community. One highlight certainly is that - for the first time really – we were able to showcase the community’s work at a couple of international conferences this year.
It started in July, with the UN’s High-Level Political Forum on Sustainable Development in New York. The HLPF, as it is known, was attended by over 2500 participants including 77 ministers, cabinet secretaries, and deputy ministers. There we had the opportunity to show a selection of vizzes, focusing on the topic of sustainable development. These were taken from Tableau Public and include a number of vizzes from different international organizations but also from data viz enthusiasts who care deeply about the topic. Click here to see the vizzes from HLPF.
In November, we were in Bonn at the COP23 Climate Summit. Together with the team from UN Global Pulse we selected a couple of vizzes on the topic of climate change and climate action, and displayed them at the Sustainable Innovation Forum, one of the many COP23 events this year. Click here to see the vizzes from the COP23 Climate Summit.
But the most exciting event for us was probably the UN’s General Assembly in September. Here the UN Action Campaign for the Sustainable Development Goals (SDGs) had set up screens in the UN lobby to show a variety of vizzes around their ongoing MY World 2030 survey.
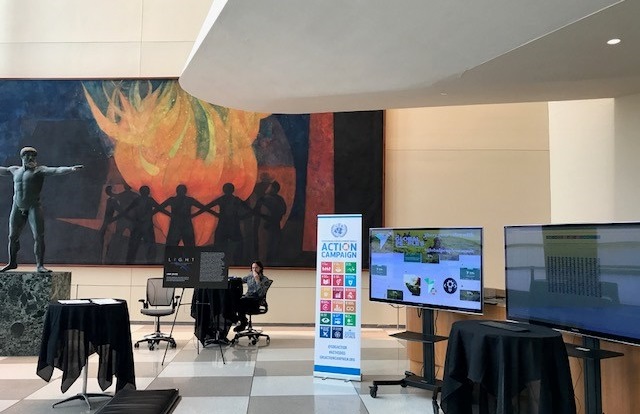
The survey tests people’s knowledge of the 17 sustainable development goals, which of these are the most important to them, and where they see the biggest improvements or deteriorations. Earlier this year, with the help of the Tableau Public team, the Action Campaign started brainstorming how they can best show the results of this survey visually. And after a couple of first promising vizzes, it was decided to open up the data to the wider data viz community to see what else its creative members would come up with. In early September a “special data viz” challenge was launched in collaboration with #MakeOverMonday and #VizforSocialGood.*
And the community accepted the challenge! Following the call to action, some 40 incredible interactive visualizations were created by people from all over the world. Everything from simple maps to more complex chart types can be found among the different submissions. Gayan Peiris from the UN Action Campaign reflects on the project: "Thanks to Eva [Murray] and Chloe [Tseng]’s efforts in organizing and promoting the challenge, we received over 40 submissions. We are inspired by the commitment and narrative visualization skills of these communities, combining data science, artistic design, and storytelling."
Click here to see the submissions from the community.
Here is hoping that one of the many politicians participating in the General Assembly had a look at some of these vizzes to get another perspective on how people around the world think about the progress on the SDGs. As Chloe Tseng from #VizForSocialGood said, “Inspiring and impactful, this collaboration is one of the best examples of how we can turn passion into real-life impact. Data visualization is not just numbers and graphs, but rather a catalyst that empowers and influences global leaders.” We couldn’t agree more and can’t wait to see what great things the Tableau community will achieve in the new year.
_______
* For those who don’t know what these hashtags stand for, #MakeOverMonday is a community project run by Eva Murray and Andy Kriebel where every Monday a new dataset is made available and then people from all around the world try their hands at creating a viz out of it. same dataset. (More information: http://www.makeovermonday.co.uk/)
#VizForSocialGood, run by Chloe Tseng is a social nonprofit that helps mission-driven organizations harness the power of data visualization for social change. It helps match nonprofit organizations that have a data projects with the experts from the talented data viz community who love to use their skills to make a social impact.
Verwante verhalen

Meet Iron Viz 2024 Finalist Jessica Moon
 15 april, 2024

Meet Iron Viz 2024 Finalist Pata Gogová
8 april, 2024

Student to BI Analyst, How Tableau Can Lead to a Successful Data Career
 20 maart, 2024
Subscribe to our blog
Ontvang de nieuwste updates van Tableau in je inbox.