Rev up mapping with new vector tiles, map styles, and background layers (now in beta)


Background maps in Tableau are an important element of building effective visualizations, because they're used to orient, frame, and contextualize your location data. We’ve taken the background map to a whole new level in the 2019.2 release (now in beta), with the new vector tiles feature. This capability means that your maps are now powered by smooth, performant vector tiles, so when you zoom in on the map, it continuously renders in the view, with no additional loading time. What’s more, all authors can now use new background map styles, like detailed Satellite Imagery or Streets, directly out of the box. Finally, we’ve added new background map layers like Building Footprints and Topographical Contour Lines, to name a few, so you can further customize your maps.
All of this functionality is available for all Tableau authors at no additional cost. It’s simple to explore these new capabilities. When you upgrade to Tableau 2019.2, your maps will automatically switch to using vector tile technology – no configuration required. You can find the new map styles and background map layers listed in the Map Layers Pane in Tableau Desktop.
There are so many ways to use these new capabilities to build beautiful, meaningful visualizations. Let’s take a look.
Seamlessly zoom into details with vector maps
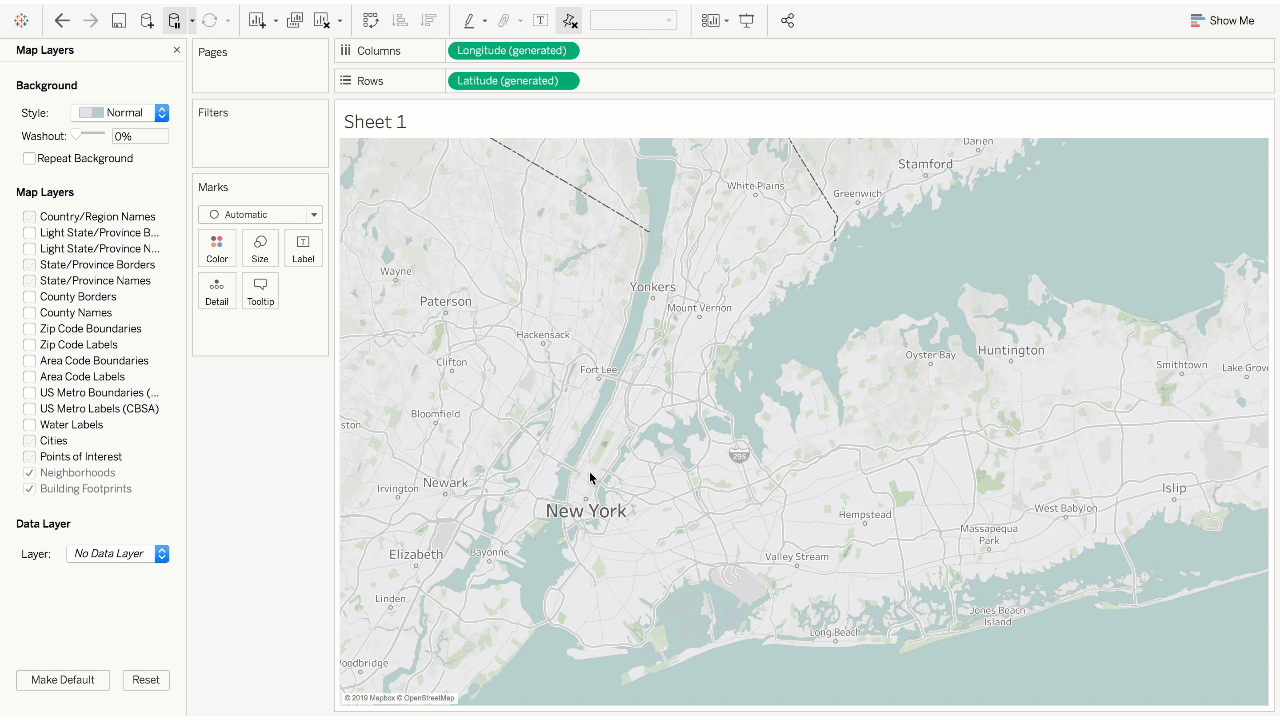
In this release, the Light, Dark, and Normal map styles were redesigned by our cartographers from the ground up, although the design principle remains the same: these map styles are optimized so that your data is the hero of the map visualization. Notice how, in the example below, as I toggle map styles, the map style smoothly fades between colors. A benefit of the vector tile technology is that the colors in the map style are simply redrawn locally on the machine. This means that, when swapping between Light, Normal, and Dark, you can expect to see reduced network traffic.
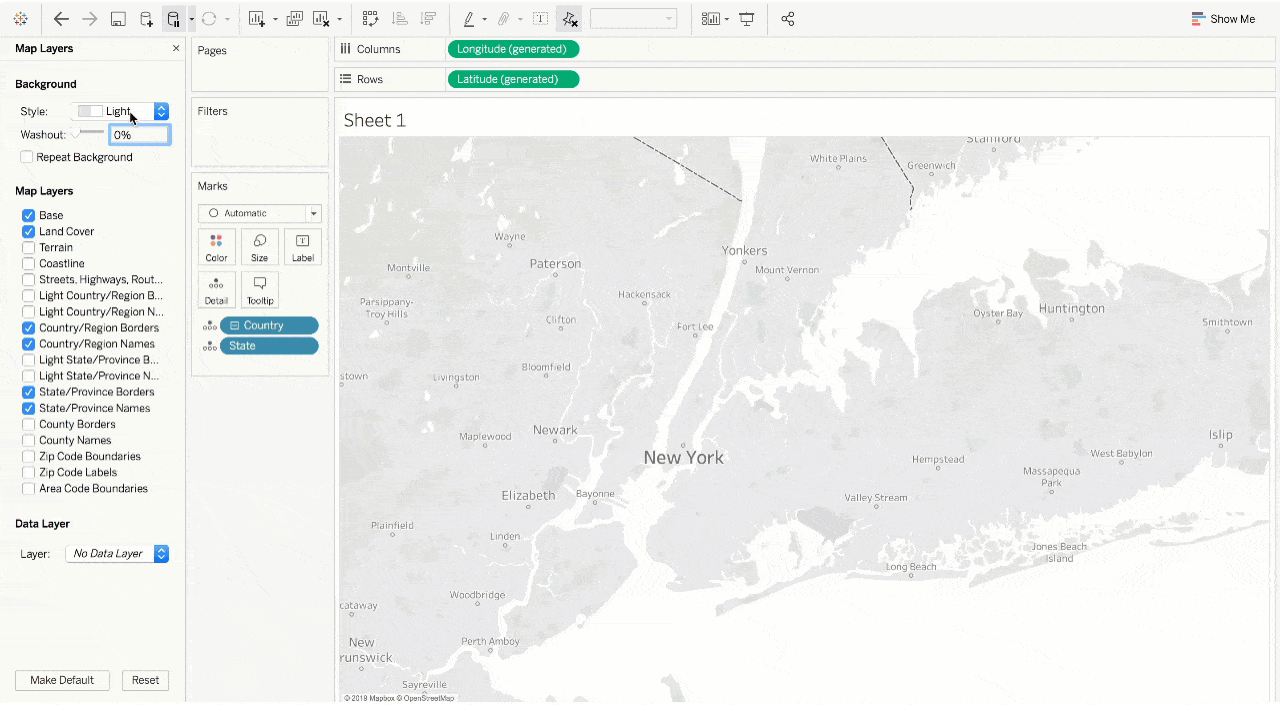
When I zoom in on the map, it continuously renders in the view—no waiting for map tiles to load! Elements of the background map, like icons and labels, automatically resize and reshape to fit the zoom level of the map. Every aspect of the map has been redesigned to give you the best interactive experience, leveraging the power of vector tiles.
See more context with the Satellite Imagery map style
Maps are a powerful tool to visualize complex information. They can be used to communicate additional detail, context, and meaning to data. But if someone is looking at a map of an area they’re unfamiliar with, it can easy to miss information that might help them contextualize that information. The new map styles introduce a simple way to increase understanding of location data.
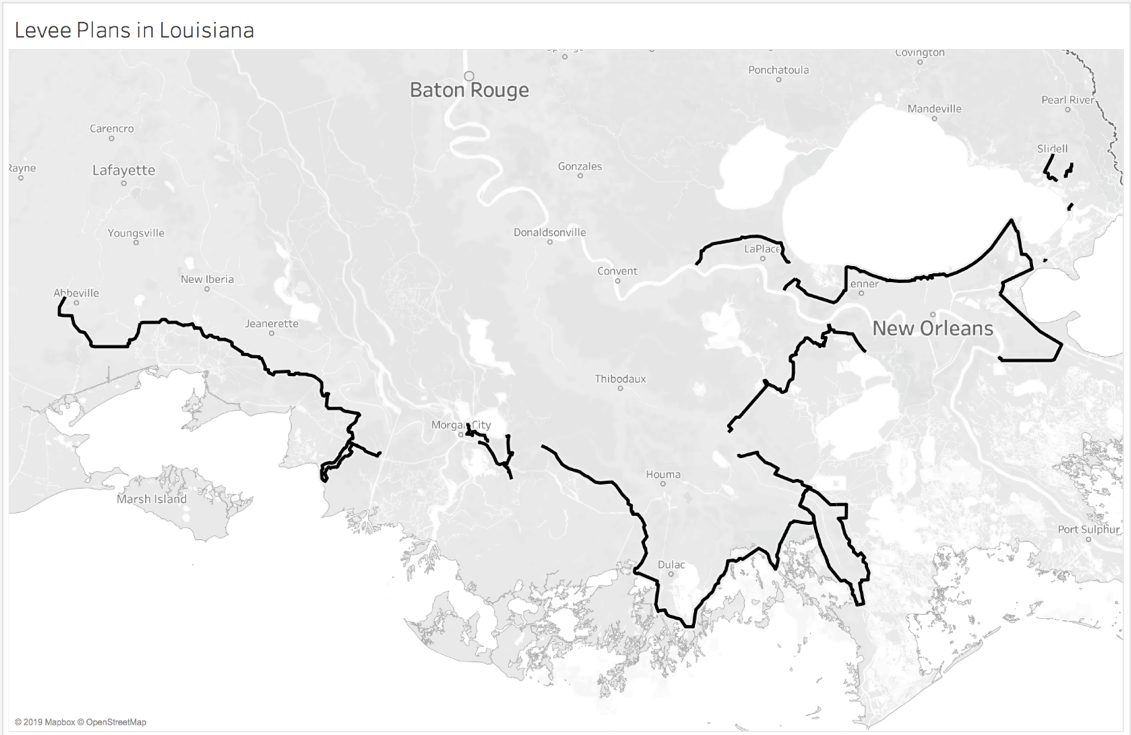
For example, I was recently studying the state of Louisiana’s plans to help protect coastal cities from the rising tides of the ocean, which have overtaken over 2000 sqaure miles of land in the state over the last 80 years. One plan involves building a network of levees, which you can see visualized in the image below.
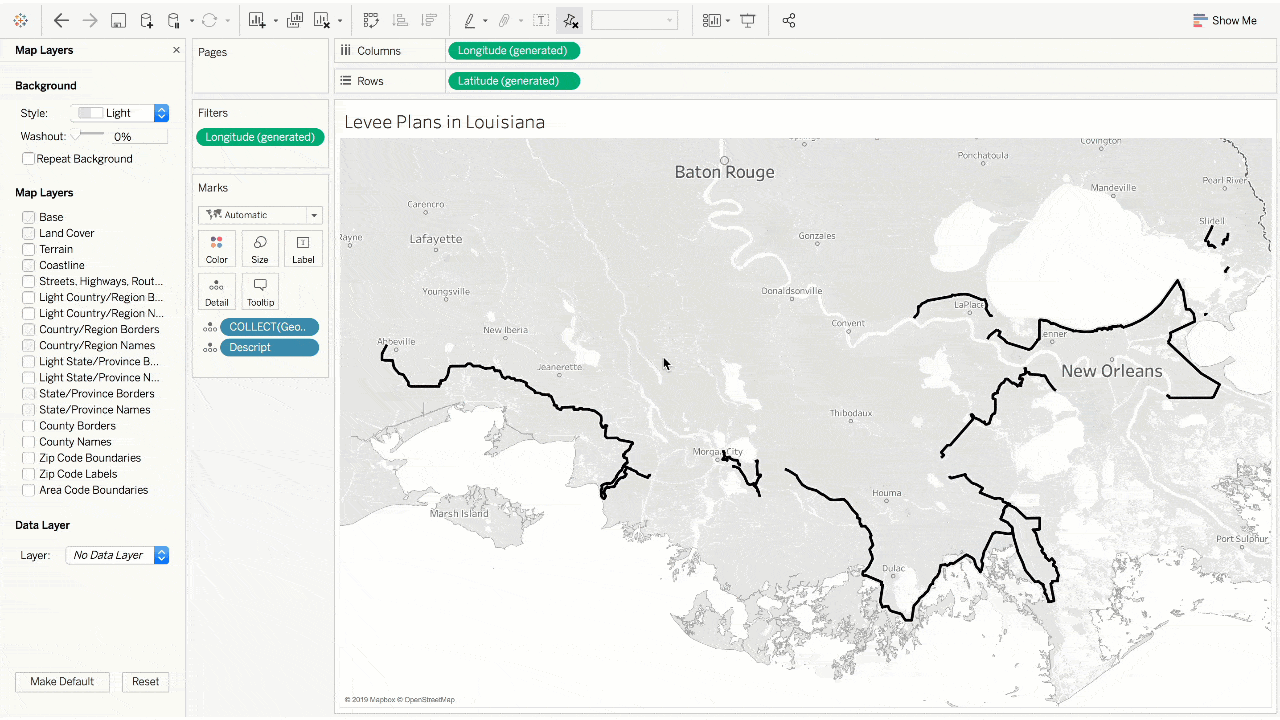
But why are the levees built so far inland? Why aren't they closer to the coast, so they can protect more land? When I change the map style to Satellite, I immediately see that the areas outside the levee bounds are largely uninhabited. This makes them less attractive candidates for emergency protection.
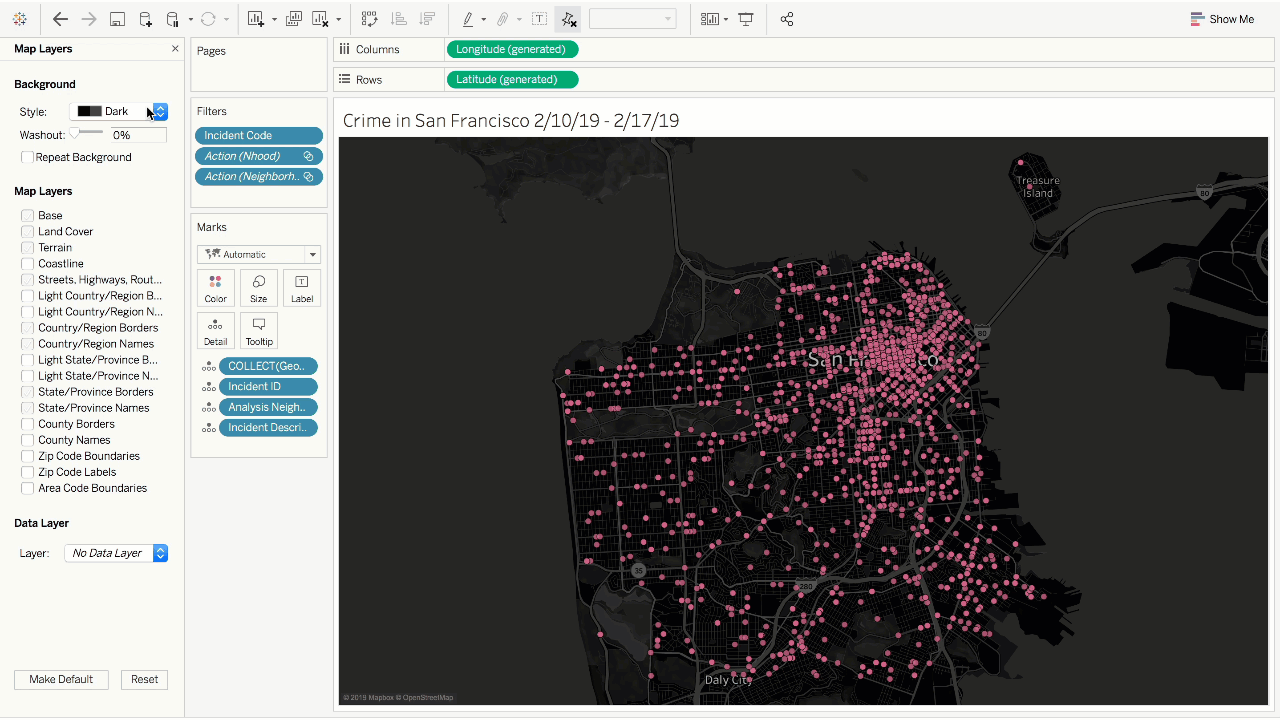
Dig into location details with the Streets map style
Although the traditional Tableau Light, Dark, and Normal background map styles are great for general data visualization purposes, there are certain instances where we might want a little bit more out of the background map, such as more granular detail or brighter colors. For example, this map is a visualization of crimes in San Francisco that took place over a one-week period this February.
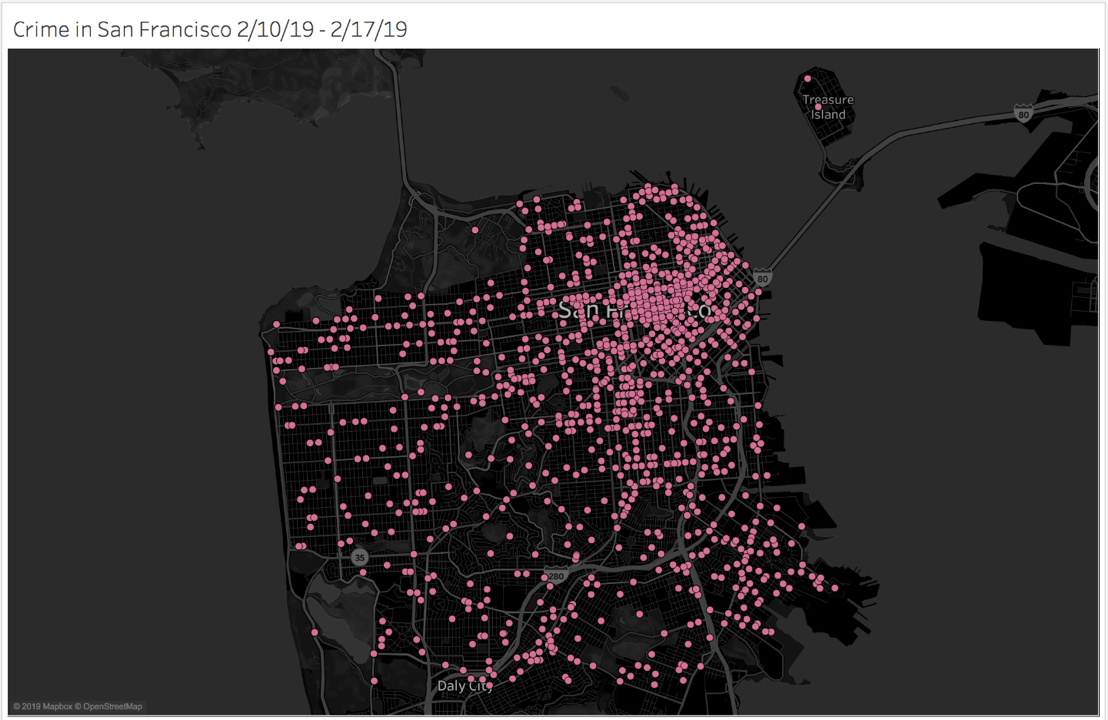
While this map shows the locations of crimes around the city, it doesn’t give me the detail I need to closely examine the data. I want to be able to ask specific questions about my data, like: what specific crimes happen around local landmarks? Where exactly did the crime occur? To give me better insight, I can switch to the new Streets map style. This map style instantly gives me a vector-tile, colorful rendering of a background map for this data, jam-packed with all sorts of details like points of interest, restaurants, and bars, building footprints, neighborhood labels, and subway and train stations.
With vector tile maps, new background map styles, and new contextual map layers, the out-of-the-box mapping capabilities of Tableau have gotten faster, more expressive, and more delightful. Exploring your location data is fast and fluid, and you can even integrate your own custom vector tile maps from third-party providers. Intended to augment your exploration of location data, these maps are built into the Tableau platform so you get the integrated experience you already know and love.
Try it today
Join the pre-release program to try out your new Tableau site home page and the new navigation experience with our Tableau Server or Tableau Online beta. While you’re there, check out other pre-release opportunities or visit our Coming Soon page to learn about our other upcoming features in the 2019.2 release.
Let us know what you think and how we can continue to improve your landing and navigating experience on Tableau Server or Online.
Verwante verhalen
Who is Einstein Copilot for Tableau for?
 10 april, 2024

Securely Access and Analyze All of Your Data with Data Connect for Tableau Cloud
How Can I Trust Einstein Copilot for Tableau?
 2 april, 2024
Subscribe to our blog
Ontvang de nieuwste updates van Tableau in je inbox.