Fighting famine with mobile data


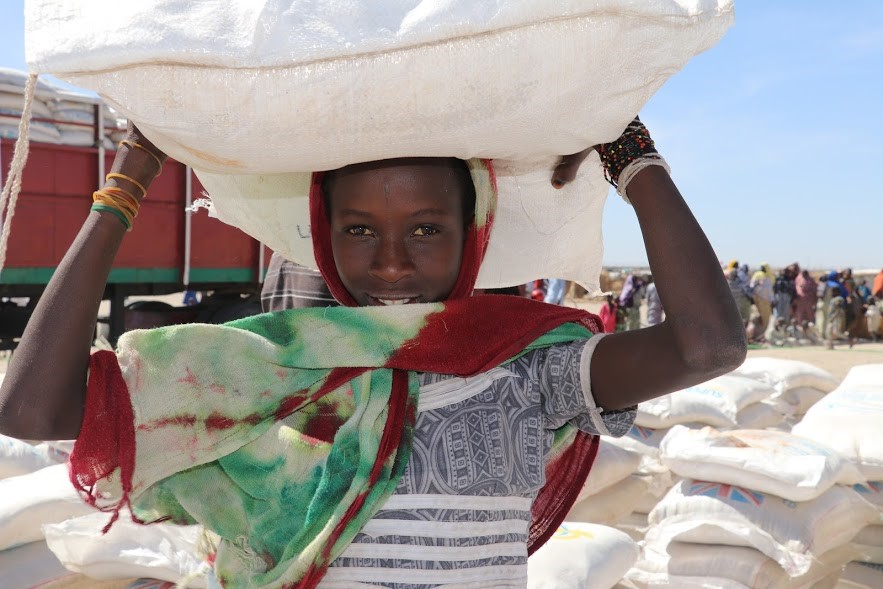 WFP beneficiary receiving her family’s food ration in December 2016 in the Ngala IDP Camp, Borno State, Nigeria. Photo Credit: WFP/Amadou Baraze
For most people, asking about the price of a bag of rice is inconsequential. For Moustapha Toure, it is a question of life and death for thousands.
A Vulnerability Analysis and Mapping (VAM) Officer with the United Nations World Food Programme (WFP) in Maiduguri, Nigeria, Moustapha and his team are currently collecting price data and assessing food security in a corner of the country wracked by the effects of the Boko Haram insurgency.
When the conflict broke out in 2009, the threat of violence made it difficult for humanitarian workers like Moustapha to access the communities they serve.
“The security situation made it impossible for the team to go to local markets, talk to vendors, or even chat with people in their homes—all the things they usually do to gather data on local food prices,” said the WFP Nigeria Country Director, Ronald Sibanda.
To overcome this challenge, WFP, in collaboration with the Nigerian National Emergency Management Agency (NEMA), turned to an innovative new approach for collecting data via mobile phones, known as mobile Vulnerability Analysis and Mapping (mVAM). Using mVAM, WFP and its partners can remotely collect food security and price data. Not only does this approach provide a way to hear from people in inaccessible areas, but it also makes near real-time reporting to local decision-makers possible. That means WFP staff like Moustapha are able to make reliable, data-informed decisions that may impact the lives of more than one million people across the affected Nigerian states.
A Vital Lifeline for a Looming Famine
The mVAM team could be in demand now more than ever. Along with Yemen, Somalia, and South Sudan, Nigeria is one of the four countries at risk of famine. Stephen O’Brien, the United Nation’s Emergency Relief Coordinator, recently described this global food security emergency as the most serious humanitarian crisis since the Second World War.
For seven years, the Boko Haram conflict has affected communities in north-eastern Nigeria, leaving some 5.1 million people food insecure in Borno, Yobe and Adamawa states and forcing an estimated 1.9 million people to leave behind their homes, land, and livelihoods.
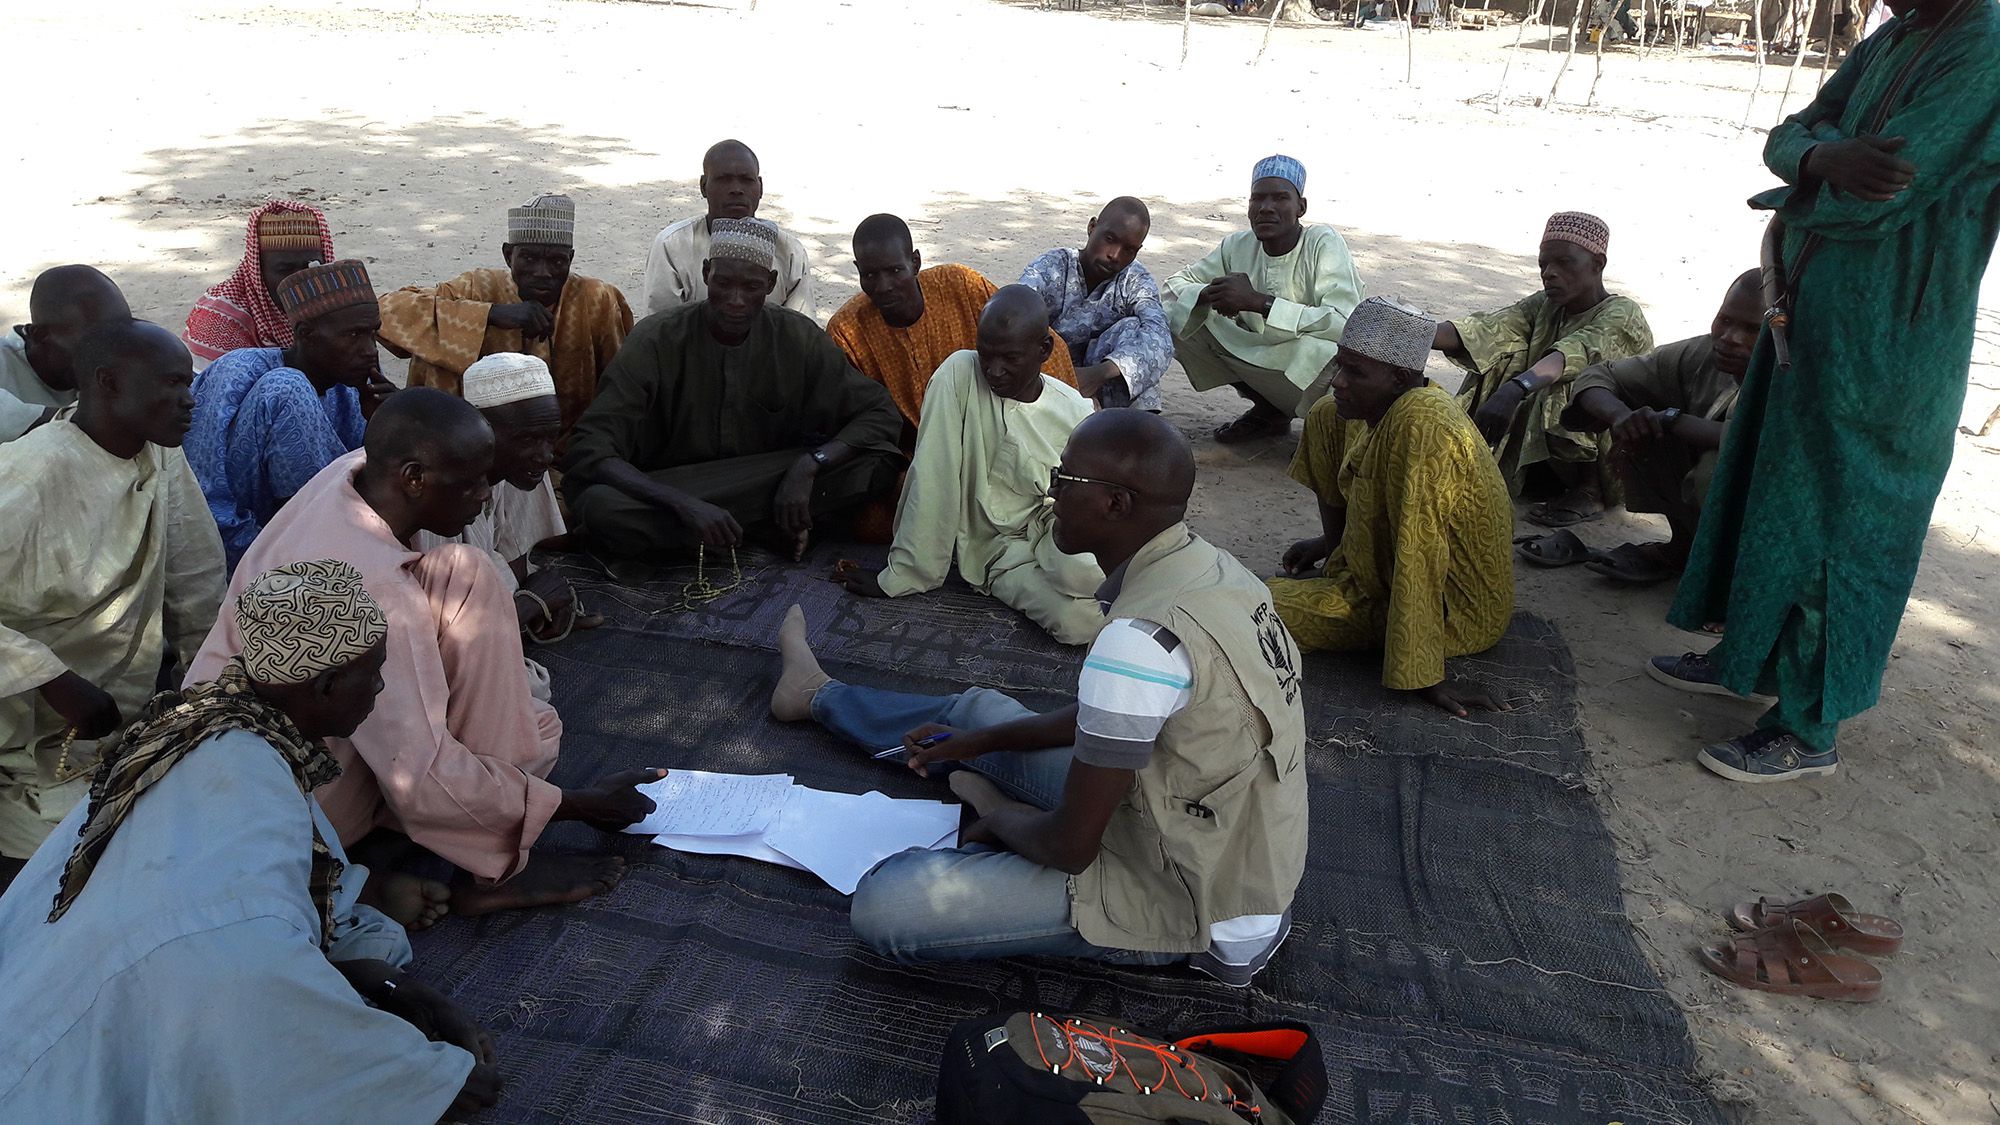 WFP's Moutapha Toure conducts Vulnerability Analysis and Mapping interviews in a village near Maiduguri, Nigeria. Photo Credit: WFP/Amadou Baraze
Without this remotely-collected information, little would be known about these areas and how the conflict is affecting food security. However, this data—collected on a regular basis—actually presents a unique opportunity. In the new system, WFP’s VAM team can take a leap forward from traditional PDF reports which take at least a few weeks, to produce a near real-time look at the situation on the ground.
Digestible Data
Rapidly analyzing and disseminating this data in a way that can be understood by a large audience of users, including field staff from other UN agencies, NGOs, and government officials, can be a challenge. WFP’s VAM team had to strike a balance between producing comprehensive reports and sharing timely and value-added statistics.
In recent months, the WFP team, assisted by Tableau volunteers, has experimented with a variety of layouts for vizzes, settling on the Tableau story point format. The original design was based on the layout and content of the bulletins traditionally produced by the WFP field offices so that decision-makers knew where to look for their information.
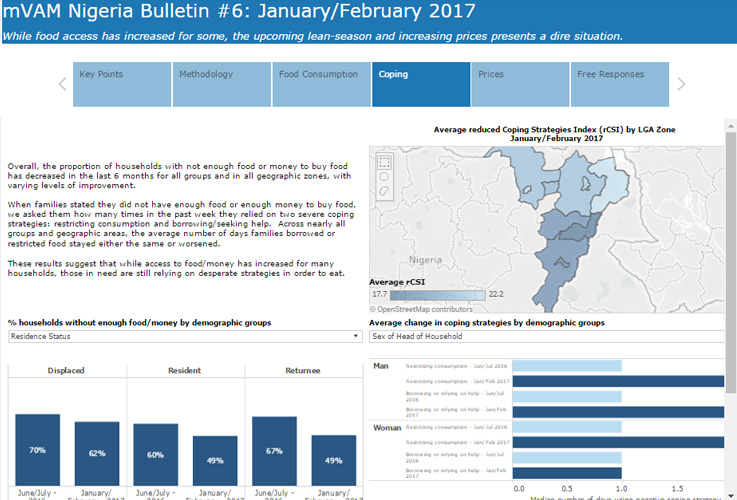
WFP documents how respondents are coping with food pricing and availability issues.
“Over the last six months, the reports have been simplified to more of a functional dashboard format. New dashboard actions and tool-tips have been incorporated to give users greater opportunities to explore the data,” said Sibanda. “And while unreliable internet connectivity leaves some officials reliant on PDF versions, the Tableau-generated PDFs have brought that production process down to a matter of minutes.”
In January, WFP collected 5,500 surveys by mobile phone using a call center in Lagos, 1,700 kilometers away from the conflict-affected areas. In addition to food prices and commodity availability, respondents were also asked what measures they thought would improve the food security situation in their community.
Responses poured in. Some people suggested that farmers should receive subsidized feed and fertilizer for their animals and access to land; others said that new job opportunities were needed. People highlighted the need to implement price controls, address the security situation, and deliver more food assistance.
With an array of different responses—all free-form text in the database, either in English or translated from local languages—the WFP team found themselves with another challenge doubling as an opportunity.
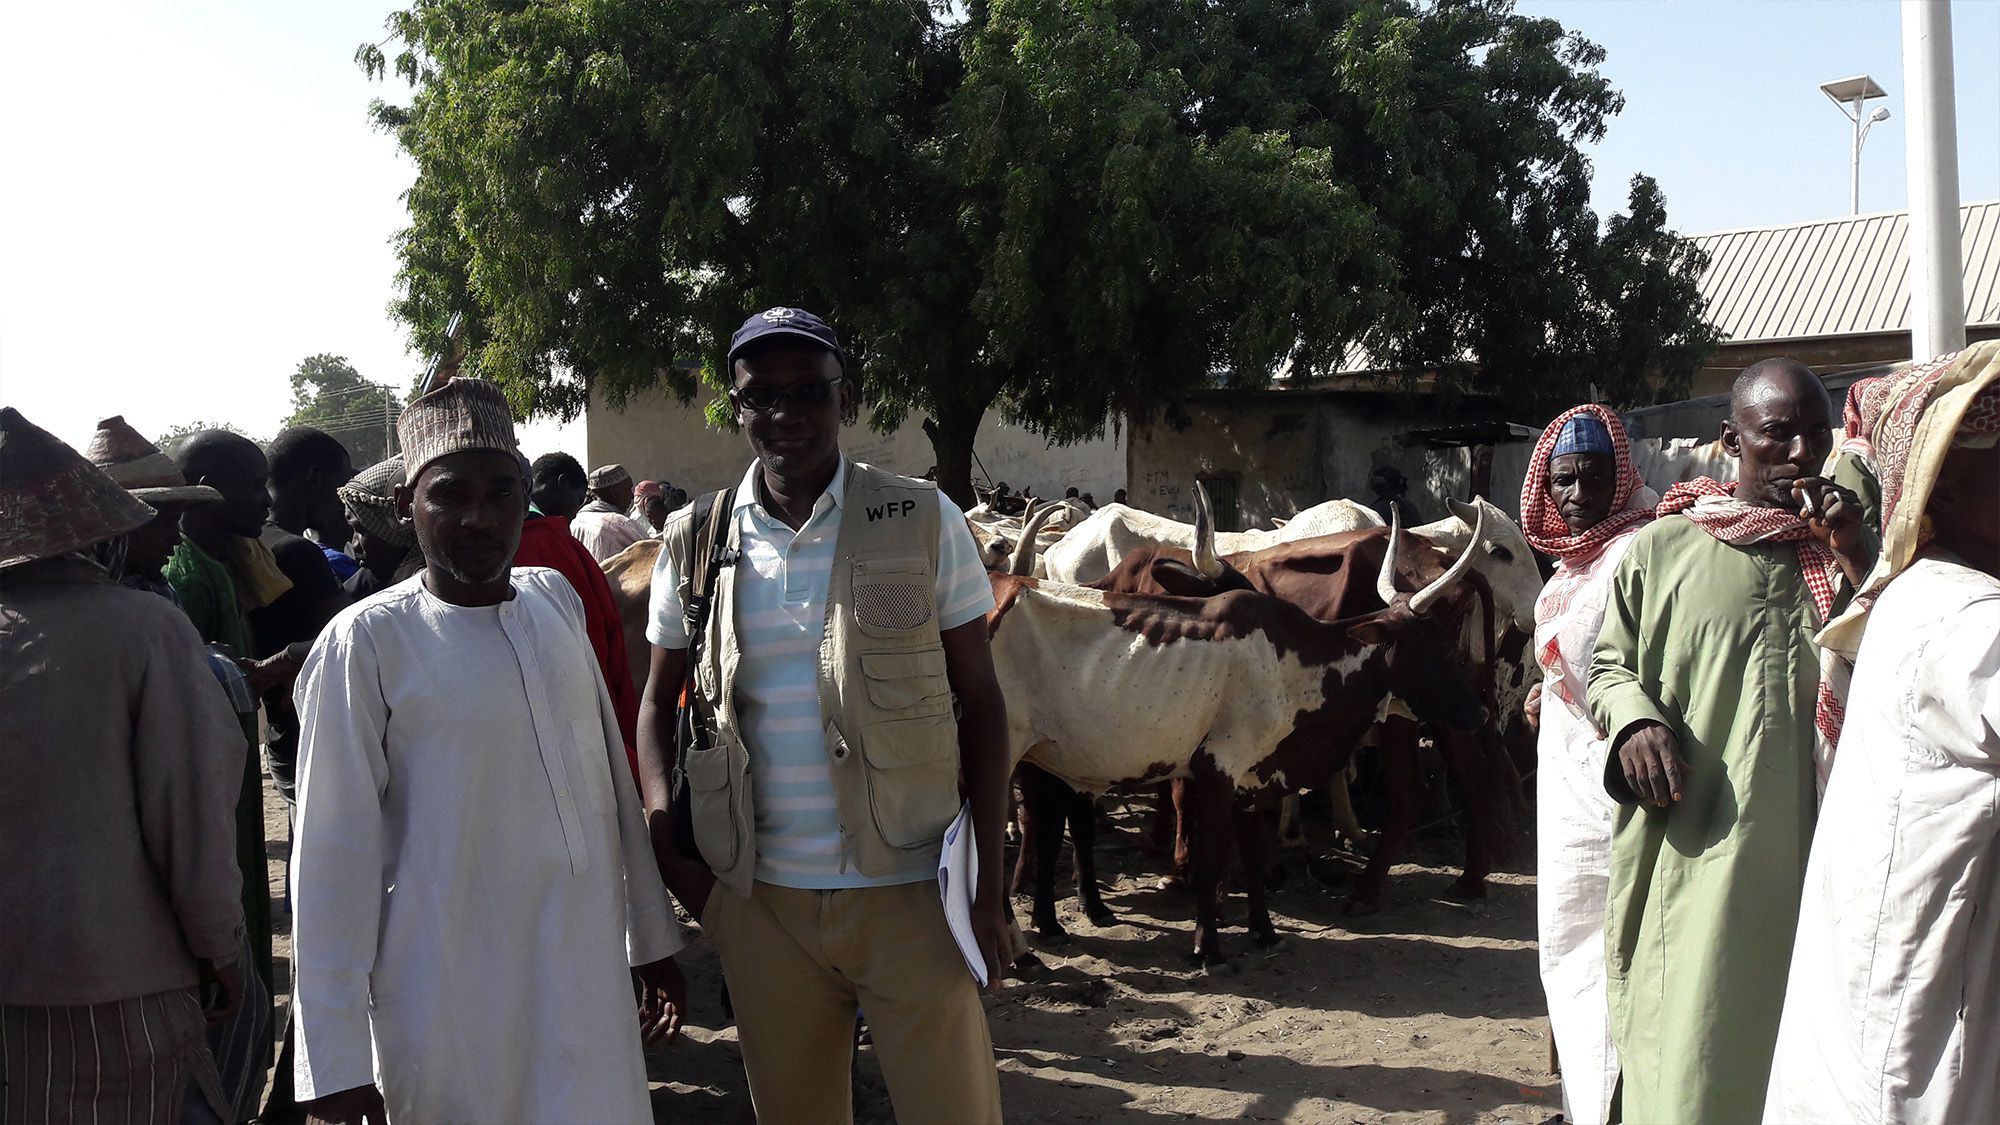 WFP's Moustapha Toure poses alongside a survey respondent at a cattle market outside Maiduguri, Nigeria. Photo Credit: WFP/Amadou Baraze
Moustapha and the team added a new story point to the traditional format, titled “Free Responses.” It is a simple bubble chart, filterable by a few key components of the respondent’s living status—gender of the respondent and the head of the household; are they displaced, residents, or returnees?; and do they have access to electricity?. The shading indicates the food consumption score of the respondent (the darker, the better, meaning that the respondent is more food secure).
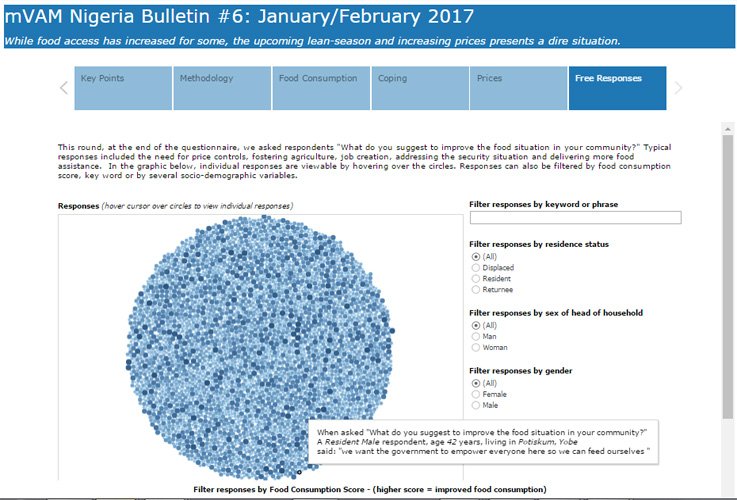
WFP displays qualitative feedback through a filterable bubble chart.
For WFP, the graphic is a chance to present the responses to stakeholders in an easy-to-understand format rather than losing them in a large database. More than that, it genuinely allows the voices of people in crisis situations to be heard. Moustapha and his team are certainly listening, as they work tirelessly to provide emergency food assistance in North-East Nigeria.
Verwante verhalen

Using data to drive conversations about climate change
 28 april, 2022
Leveraging data to improve forestry practices worldwide

Doing Good Data Means Doing No Harm
 13 december, 2021
Subscribe to our blog
Ontvang de nieuwste updates van Tableau in je inbox.