
Ask Data, Tableau’s natural language capability, is built to work with all your published data sources on Tableau Server or Online. But in order to take advantage of all the benefits of Ask Data, your data sources need to be curated to support an optimal analytical conversation.
To help you deploy Ask Data in your organization, we’ve put together this guide on how to curate data sources for a successful user experience.
Understand people's questions
Ask Data leverages context to determine the attributes of the relevant data type, breaking utterances into tokens—phrases containing temporal, spatial, or numerical expressions—to understand intent. It then uses visual best practices to determine the most appropriate visualization to satisfy the user’s intent.
Let’s say someone wants to ask questions of a published data source containing year-to-date sales. They can type a question like “what is the profit over time?” into the Ask Data input box. In this case, Ask Data resolves the user’s intent by aggregating “Profit” as a sum—the default aggregation. It also resolves the intent of “time” to the attribute “Order Date” in the data source, aggregated at its year level (Figure 1).
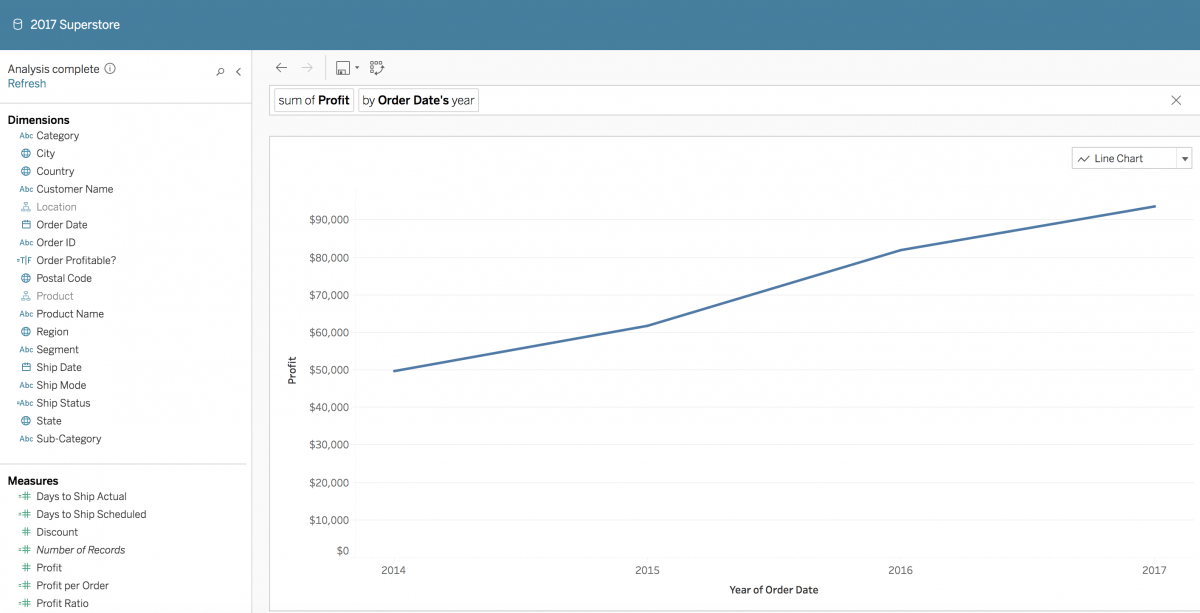
Figure 1: Visualization output from the expression “what is the profit over time?”
Ask Data’s inference algorithm is most effective when all the attributes are of the expected data type. In this example, the expected data type would be Date, which produces the time-series visualization (trend over time). Measures should be specified with the expected default aggregation and numerical formatting.
With the Ask Data feature, you can ask questions in English about calculated fields, column fields, group fields, and bin fields in your published data sources. Ask Data does not currently support sets, parameters, combined fields, combined sets, or hierarchies. Tableau is working on adding support for these field types in later releases.
Supported analytical expressions in Ask Data
There are five basic types of analytical expressions. An utterance is made up of one or more of these expressions.
The following analytical expressions are supported in Ask Data:
Ask Data provides some common built-in synonyms for these concepts, like “from largest” for descending order and “mean” for average. It also provides some abbreviations like “cnt” for count, “avg” for average, etc. Skip ahead to learn how to add user synonyms to Ask Data.
Additionally, Ask Data represents temporal expressions—expressions relating to time—as either absolute or relative. Ask Data supports absolute time concepts, with expressions like “starts in,” “‘ends in,” and “between.” It also supports relative time concepts for expressions like “last 3 years,” “next quarter,” “this month,” “today,” and “yesterday.”
Prepare data sources for an optimal analytical conversation
Ask Data is designed to work with any published data source on Tableau Server or Online. To provide convenient defaults for filter expressions, Ask Data enriches the semantic model with metadata about the fields. For continuous numerical measures, this metadata includes statistical information such as “minimum,” “maximum,” and “average.” For text fields, metadata contains the most commonly occurring values.
As a user types a filter expression in Ask Data, this metadata allows the system to provide suggestions for values. For example, in the figure below, “$4” is provided as the minimum value in the metadata for the attribute “Price” and the filter “at least.”
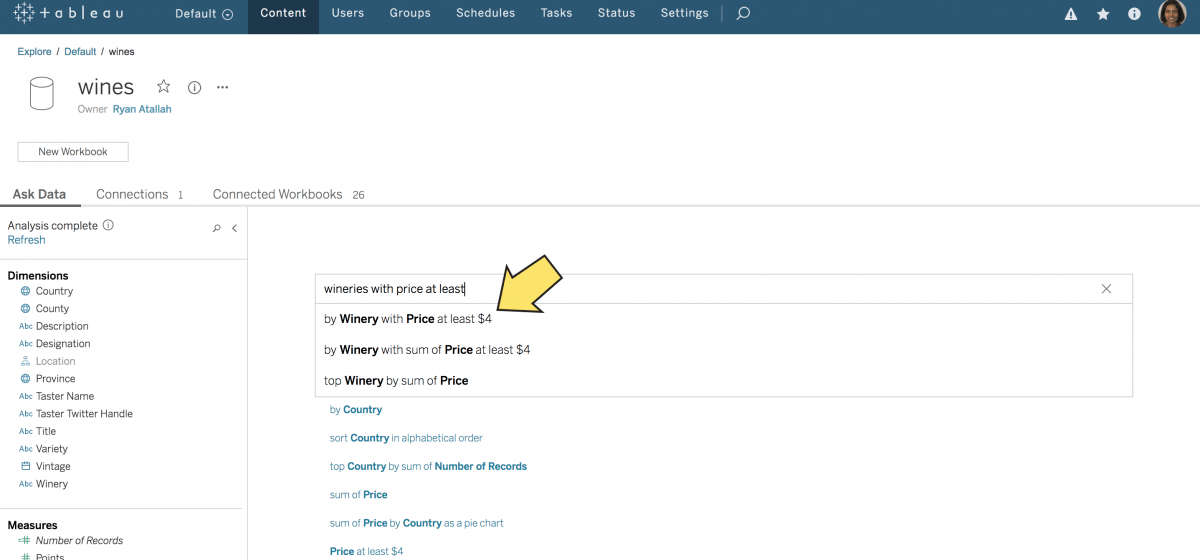
Figure 2: “$4” is provided as the minimum value in the metadata for the attribute “Price” and the filter “at least.”
For data sources with row-level security, Ask Data does not profile, index, or store metadata for the fields in the semantic model. With the absence of metadata, Ask Data cannot provide filter defaults (as shown in Figure 2), recognize comparative concepts such as “cheap” or “high,” or show profile data in tooltips in the data pane.
However, we understand that row-level security requirements exist for some data sources. In these circumstances, Ask Data can’t index your data sources, but you can still take advantage of the benefits of Ask Data by specifying the exact values you want to filter on and surrounding those values in quotes.
For example, let’s say you wanted to see “wineries in california that have pinot noir”. If the data source had row-level security, you would need to input your query as:
No need to use quotes for dates, booleans, or numbers, since Ask Data can automatically interpret values of those types and match them to appropriate fields.
If you already publish certified data sources for your organization, teams can leverage these sources in Ask Data. But you may want to open up additional sources to your end users or reshape existing sources for easier analysis in Ask Data. To get the most out of the Ask Data feature, curate your data with the following factors in mind.
Curate your data with the end user in mind
Ask Data users are far more successful at answering questions when the data has been carefully curated by a data steward or analyst who both understands how to prepare data for analysis and can anticipate the kinds of questions users will ask of the data using natural language.
Read more about best practices for curating a Published Data Source.
When curating data for Ask Data, start by simplifying your published data sources as much as possible. That means keeping a minimal set of fields that users will query in their interaction with Ask Data and removing (or hiding) unnecessary fields from the data source. Ask Data supports data sources with up to 1,000 fields, but the less ambiguity, the better. This helps with the overall system performance for faster initialization time and parsing of the natural language utterances. If the data source is slow, use a data extract with datasource filters (if needed) to improve performance.
Consider the following factors when curating data sources for querying in Ask Data:
Prepare your data. Try to anticipate the types of questions users will want to answer with the data source. Data shaping, join operations, and related data prep functions may be needed to get the data into a suitable shape for answering these anticipated questions.
Set up appropriate field defaults. Give each field the correct data type (e.g. string, number, geographic, date, datetime, boolean) and data field role (e.g. discrete vs. continuous, measure vs. dimension). For each measure, assign default aggregation functions. For example, SUM may be an appropriate default for “Sales,” but AVERAGE might be a better default for “Test Score.”
Set up percent and currency number formats. To support common, colloquial concepts that people tend to ask of their data, Ask Data includes concepts such as “low,” “high,” “lowest,” “highest,” and currency-based concepts such as “cheap” and “expensive,” along with their corresponding synonyms. To facilitate utterances like “show me the cheapest wineries in France,” set up measures in the data source with the appropriate currency format (as shown in Figure 3 and 4).
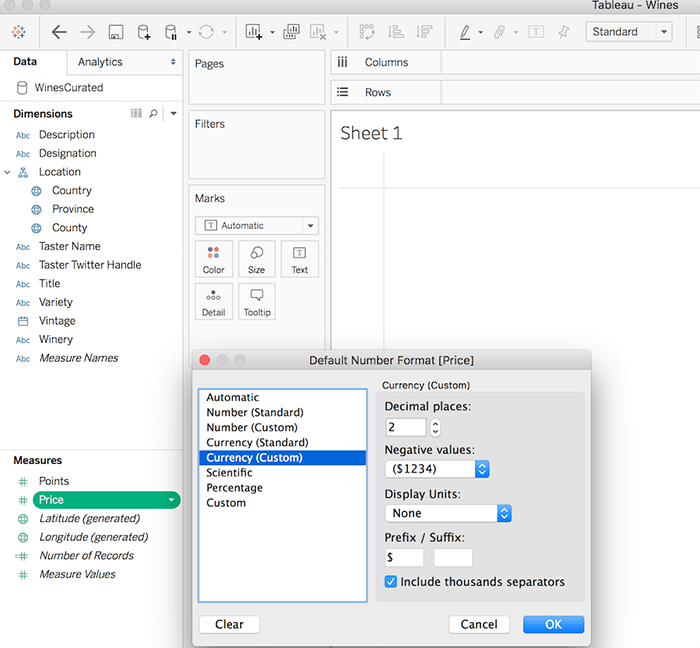
Figure 3: Set up measures in the data source with the appropriate currency format.
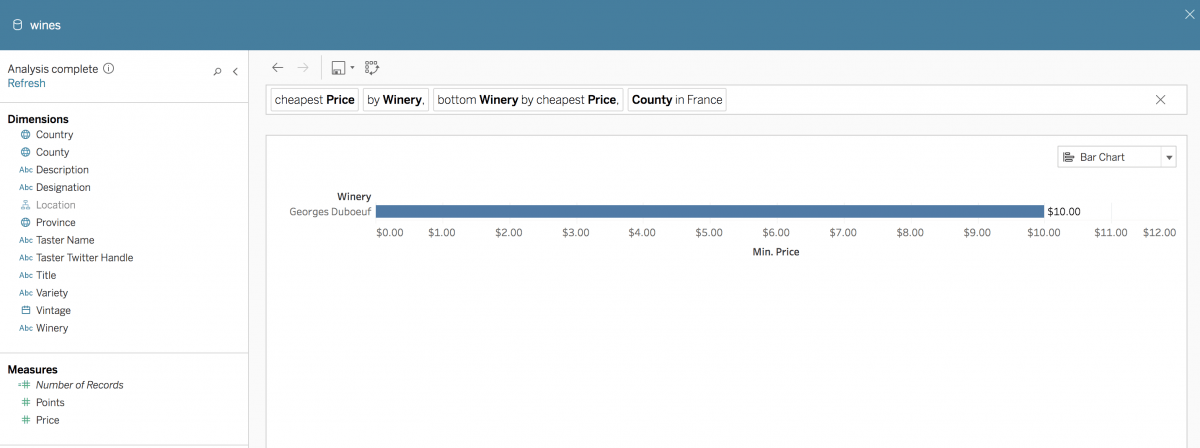
Figure 4: For the utterance “cheapest wineries in France,” the system infers a currency attribute ‘Price’ for the concept ‘cheapest.’ Ask Data infers a numeric range from the metadata for ‘Price’. Clicking on ‘cheapest’ refines the inferred numerical values.
Set up logical hierarchies. This allows users to drill up and down within visualizations produced using Ask Data. This applies to geographic dimensions (e.g. City, State, Country), dates and time (e.g. year, quarter, month), and functionally dependent dimensions (e.g. Category and Sub-category).
Create meaningful binned fields (with appropriate bin sizes) for quantitative variables in the following scenarios:
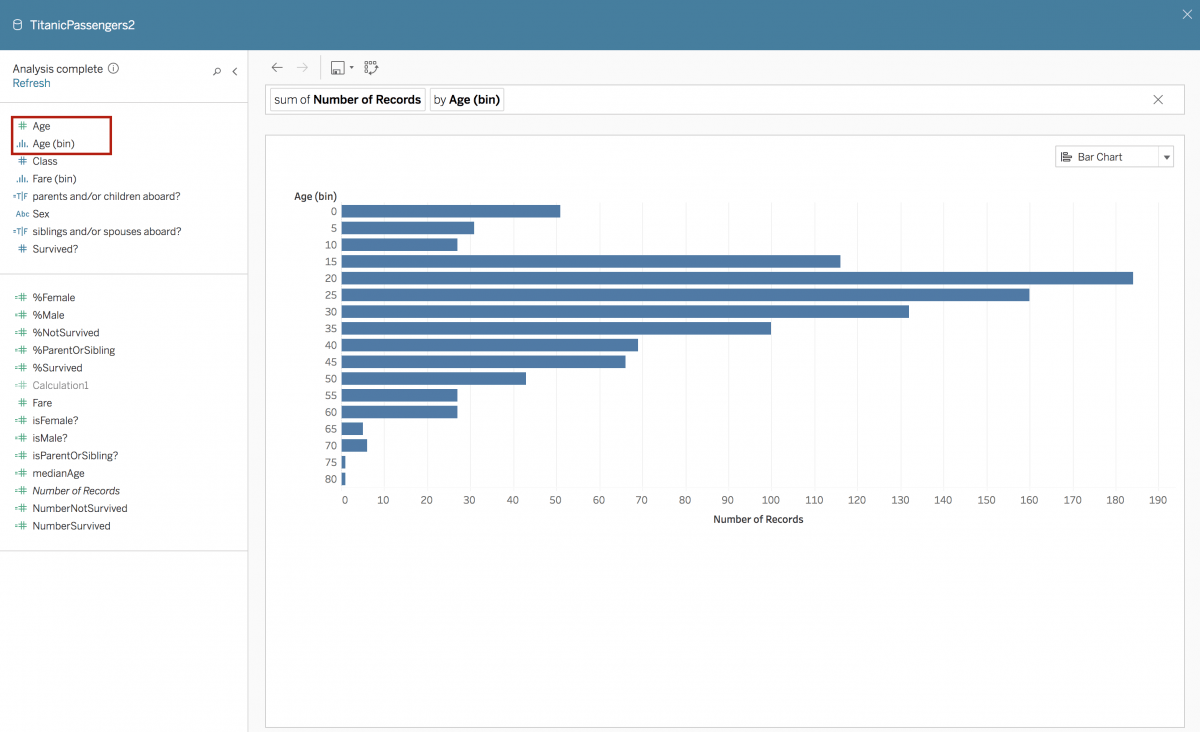
Figure 5: A user can type “by Age (bin)” to view a binned form of the dimension as a bar chart.
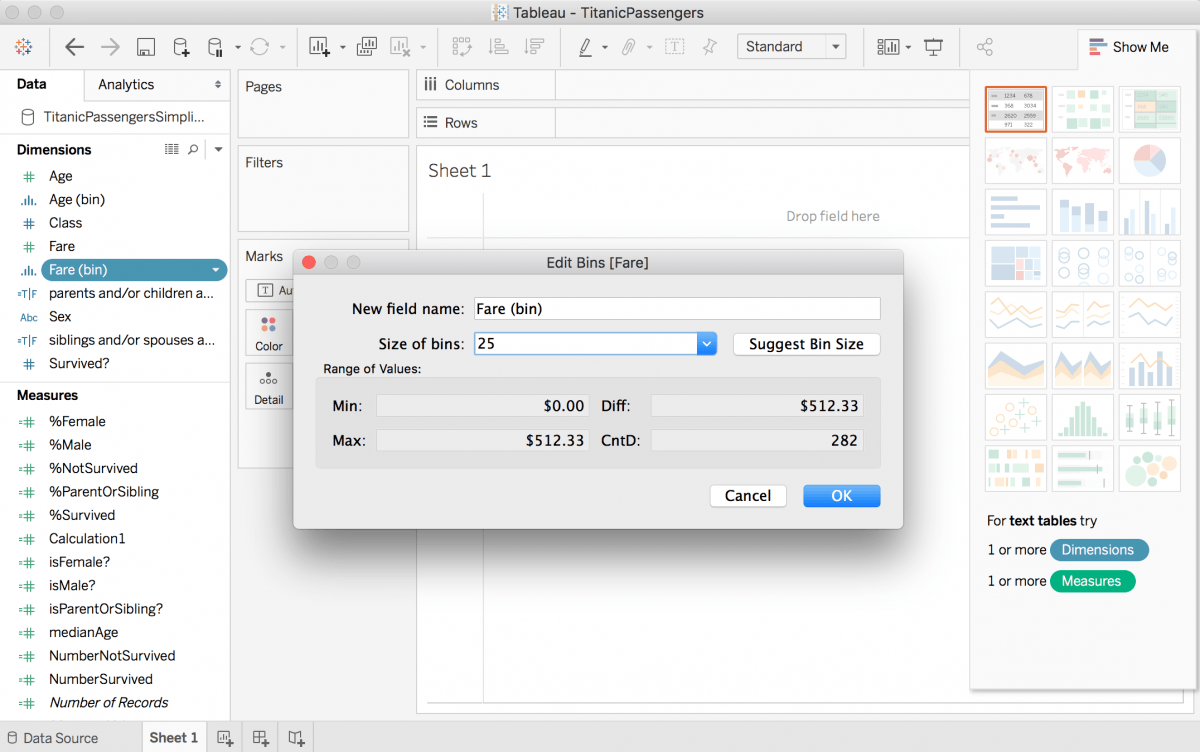
Figure 6: In the Data pane, right-click (control-click on Mac) and select Create > Bins.
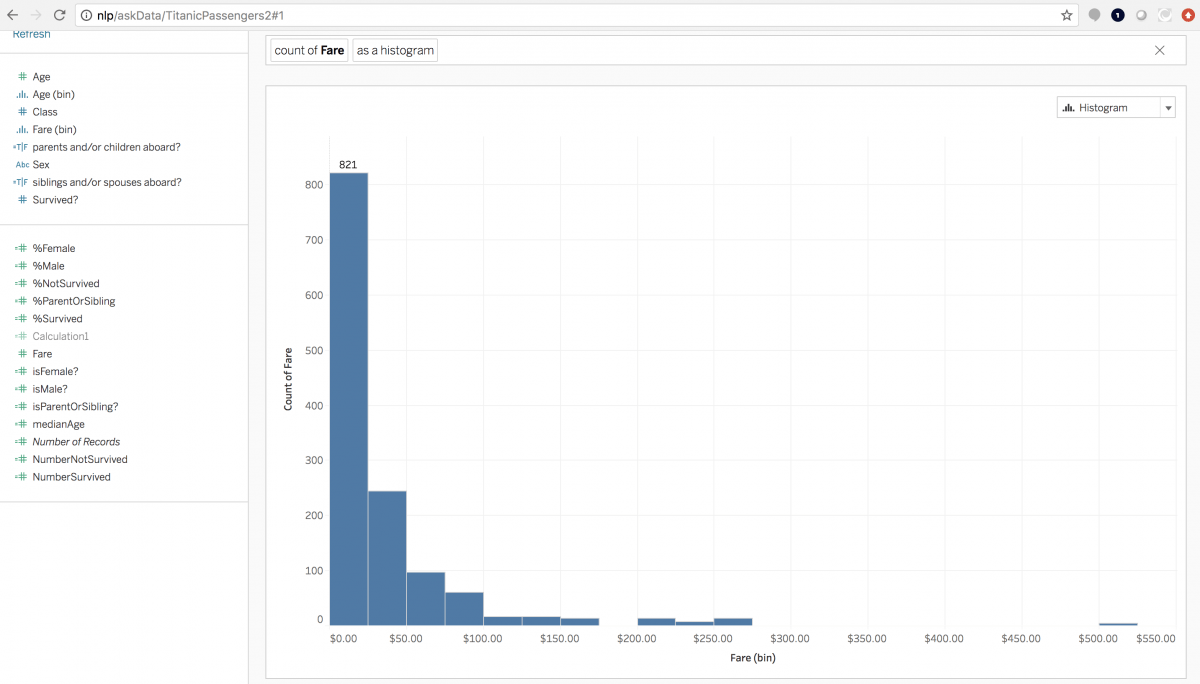
Figure 7: Visualization output of the expression, “Fare as a histogram” with custom bin sizes.
Give fields unique and meaningful names
To make your data source more understandable by end users—and increase the chances that people get the answers they need from Ask Data—you should audit the field names in your data source.
Take the following steps for an ideal user experience:
Create meaningful aliases for field values. In Tableau Desktop, you can create user-friendly field names with aliases (e.g. “CustID” is “Customer ID”). This is a standard recommendation for data curation. For Ask Data, you can take this a step further by adding synonyms. For example, people may also use “Customer Number” to refer to “Customer ID” internally. In these circumstances, you could add these additional synonyms to Ask Data to support users’ questions.
Differentiate your attributes. Assigning unique names to attributes in your data source can provide a better user experience in Ask Data. If there is ambiguity in the expression, Ask Data finds strings that approximately match a pattern in your data up to one character difference, also known as fuzzy string matching. Ask Data then shows these multiple matches as options. In the example below (Figure 8), multiple attributes containing the word “Sales” exist in the data source. However, just typing “sales” only matches three attributes as the input word “sales” and the attribute “Sales Foo” differ by more than one character.
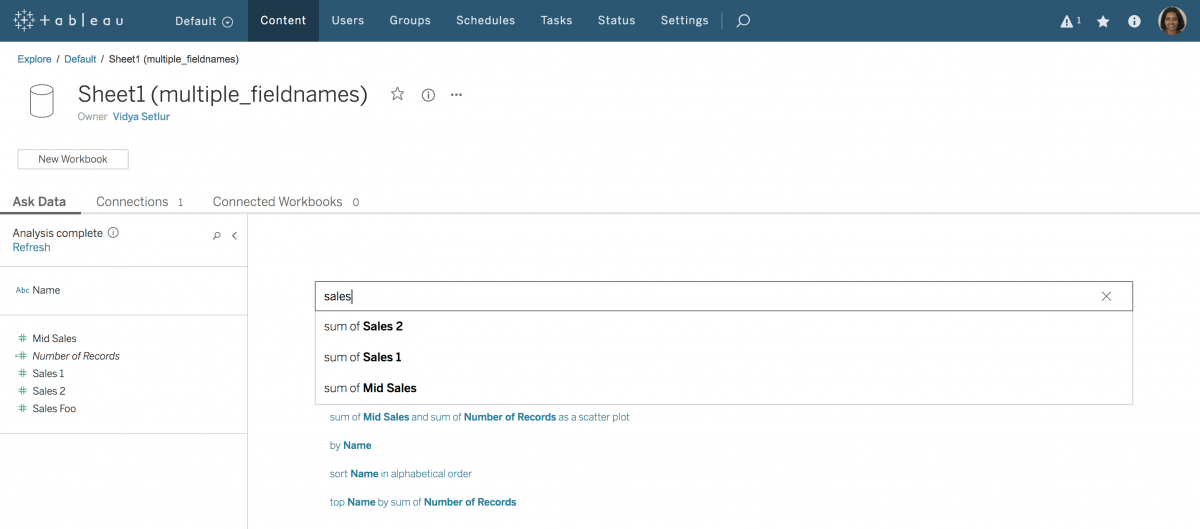
Figure 8
It is also recommended to name attributes that are semantically meaningful to the domain of the data source so that the questions posed in Ask Data are intuitive to the analytical task. For example, “Number of Records” is renamed as “Number of Earthquakes,” where each record is an earthquake in the data source (Figure 9).
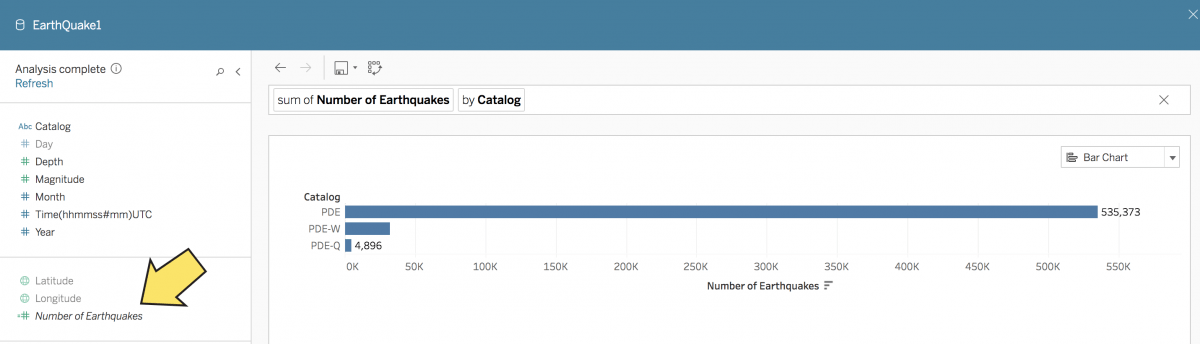
Figure 9
Check field names. Ask Data filters values by the fields in the data source. Avoid naming fields as values to prevent Ask Data from misinterpreting data fields as values (e.g. numbers, dates, or boolean values such as “true” or “false”). Also, for performance reasons, Ask Data doesn’t index fields that overlap with the supported analytical expressions. For example, avoid using field names like “Average,” “Sales in 2015,” or “Most Products Sold.”
Geocode geographic fields. For fields with geographic roles, be sure that the data values are successfully geocoded. Fields whose values are successfully geocoded are recognized as geographic attributes in Ask Data, indicated by an icon in the data pane (Figure 10). Such attributes support utterances like “where are the highest fire fatalities?” with the system recognizing the token “where” to indicate a map and inferring a valid geographic attribute like “County.”
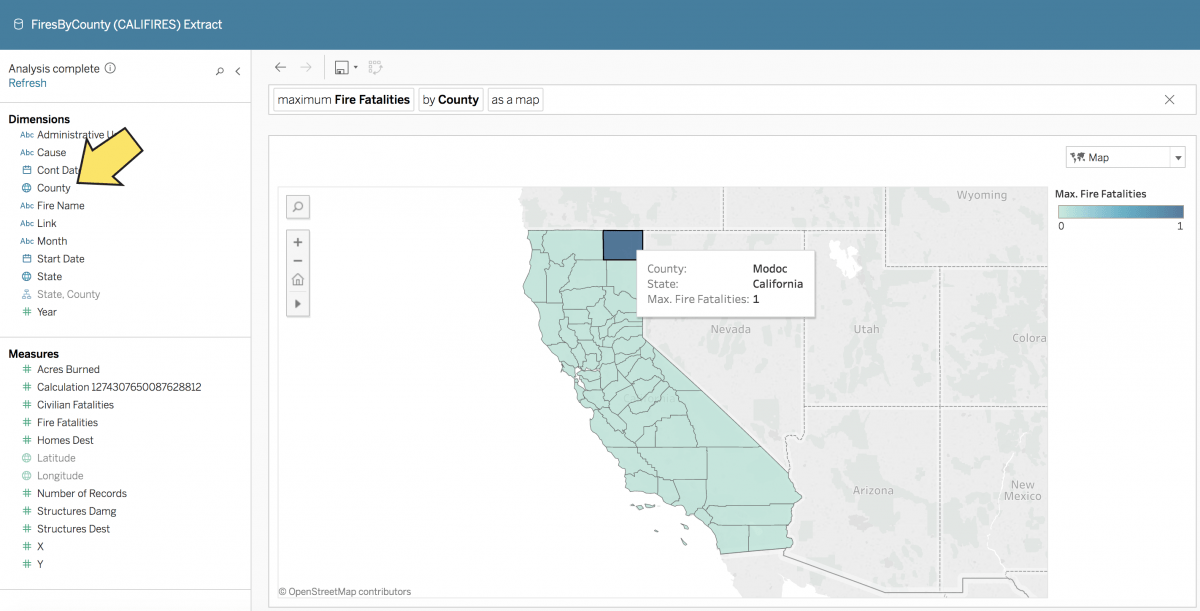
Figure 10
Add relevant calculated fields
Ask Data cannot create on-the-fly calculations, so you need to add anticipated calculations to the data source in advance. For example, creating a calculated field called “Total Compensation” that adds the minimum base salary from “Base (Variable)” with the total commission from “Commission (Variable)” allows users to type questions like “what is the total compensation for each sales person?” (Figure 11 and 12).
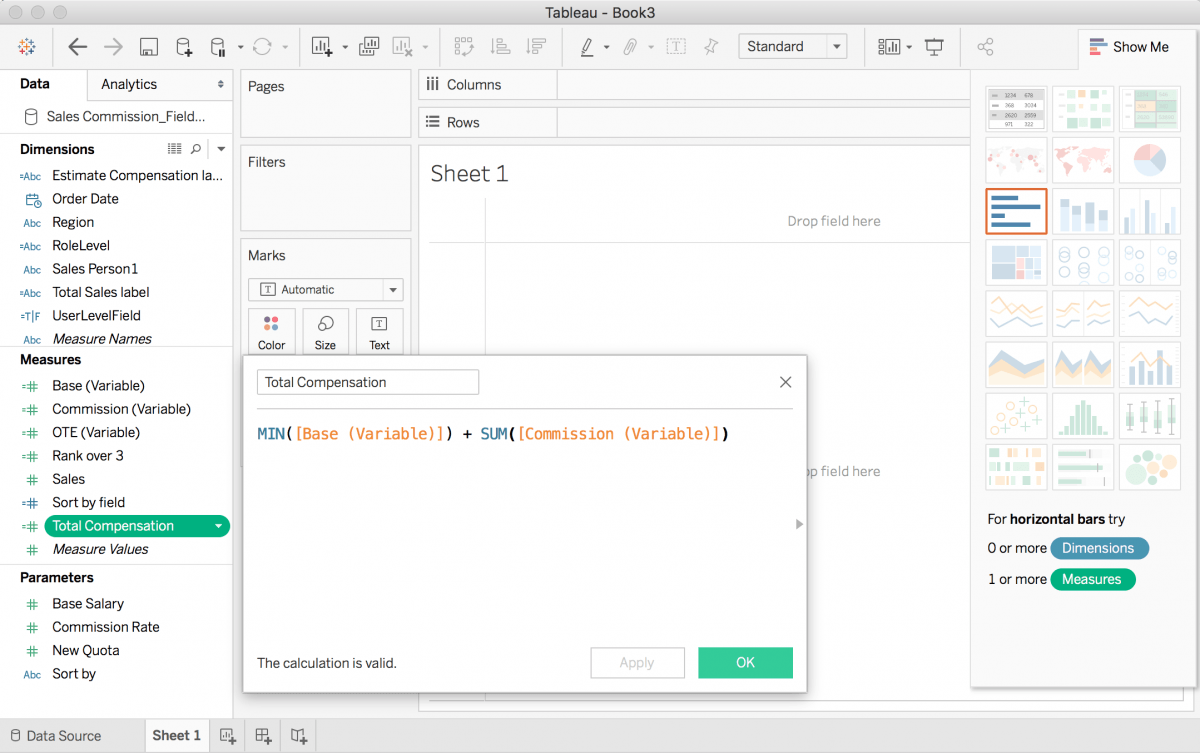
Figure 11: To create a calculated field, select Analysis > Create Calculated Field. To edit a calculated field, right-click the calculated field in the Data pane and select Edit.
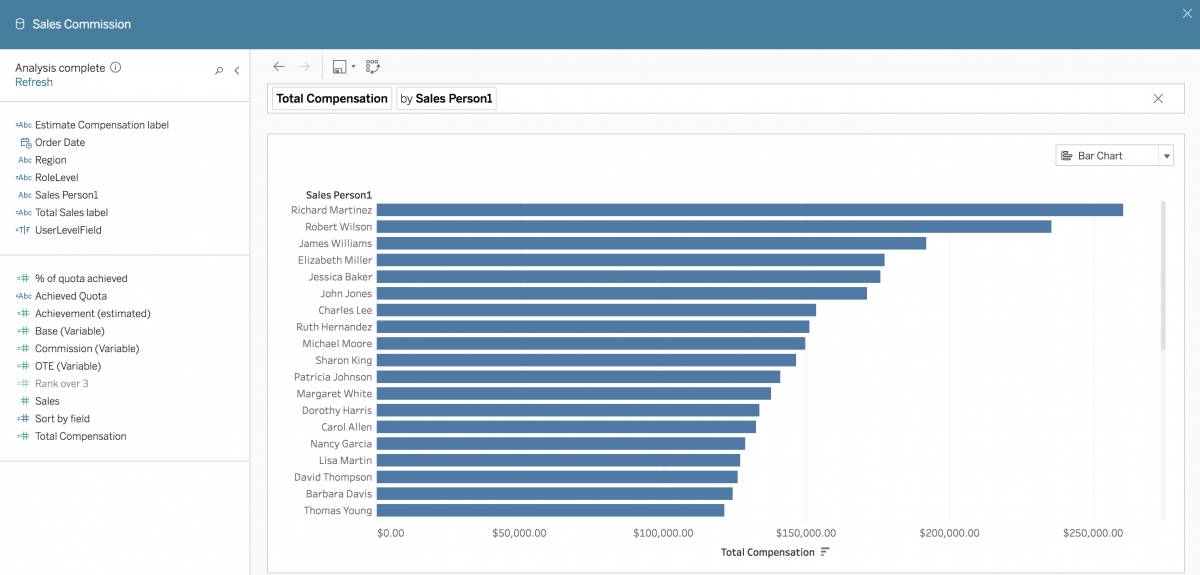
Figure 12: Creating a calculated field called “Total Compensation” that adds the minimum base salary from “Base (Variable)” with the total commission from “Commission (Variable)” allows users to type questions like “what is the total compensation for each sales person?”
Enrich data with user synonyms
You can define synonyms for fields within a data source through the Ask Data fields pane. For example, let’s assume you have a data source on car purchases and one of the fields is “New Vehicle Model.” Adding “vehicle purchased” and “car” as synonyms for the “New Vehicle Model” field, can support natural language utterances such as “vehicles purchased by city” (Figure 13).
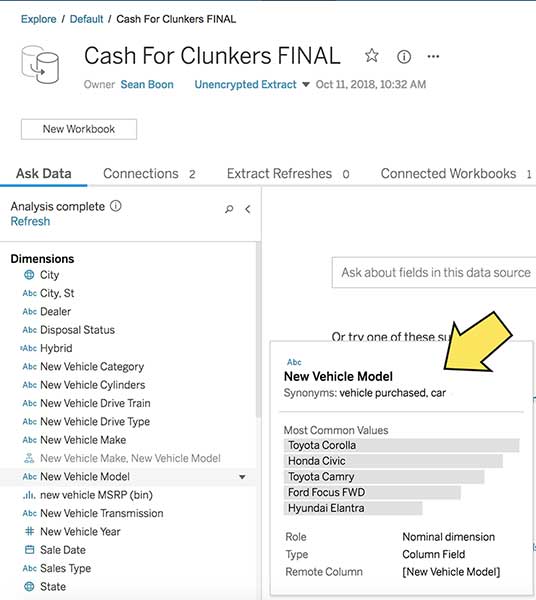
Figure 13: To add synonyms for specific data fields, hover over a data source field, click the down arrow, and choose Edit synonyms. Enter synonyms for the field name, separated by commas.
Enable data access and governance
Ask Data has the same security and governance measures you are familiar with in Tableau Server or Online. The following sections provide more information on using certified data sources with Ask Data and controlling access to Ask Data throughout your organization.
Set roles and permissions
Once you’ve curated your data for Ask Data, you can control who has access to the feature. To use Ask Data, users need Creator or Explorer roles and have web authoring access on Tableau Server or Online. Tableau Server administrators can specify permissions at the site level to determine who has access to web authoring capabilities (as shown in Figure 14). Both analysts and business users will find value from Ask Data as a quick and easy way to explore a data source and find meaningful insights on the fly.
Learn more about web authoring permissions.
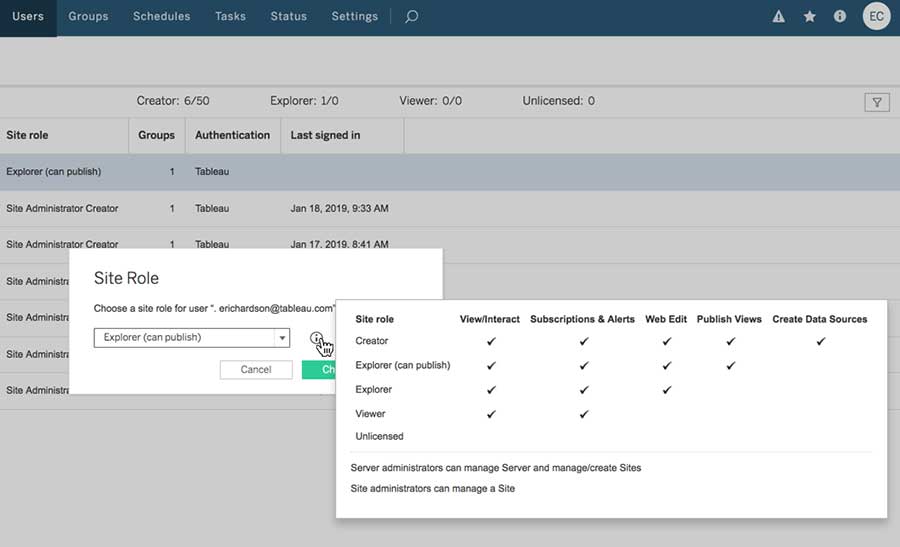
Figure 14: Specify permissions at the site level to determine who has access to web authoring capabilities (including Ask Data).
Check certified data sources
Users can certify a data source on Tableau Server or Online to indicate that it is trusted and curated. This certification is not feature-specific; there is no Ask Data specific certification. However, if a user wants to specifically disable Ask Data for a data source, they can do so in the data source settings in the Tableau Server user interface (as shown in Figures 15 and 16).
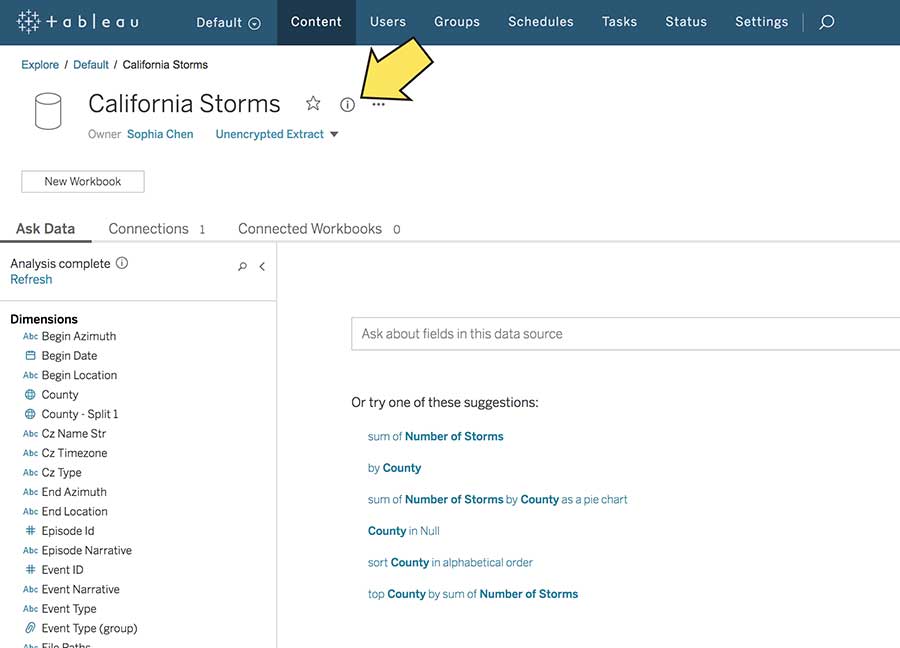
Figure 15
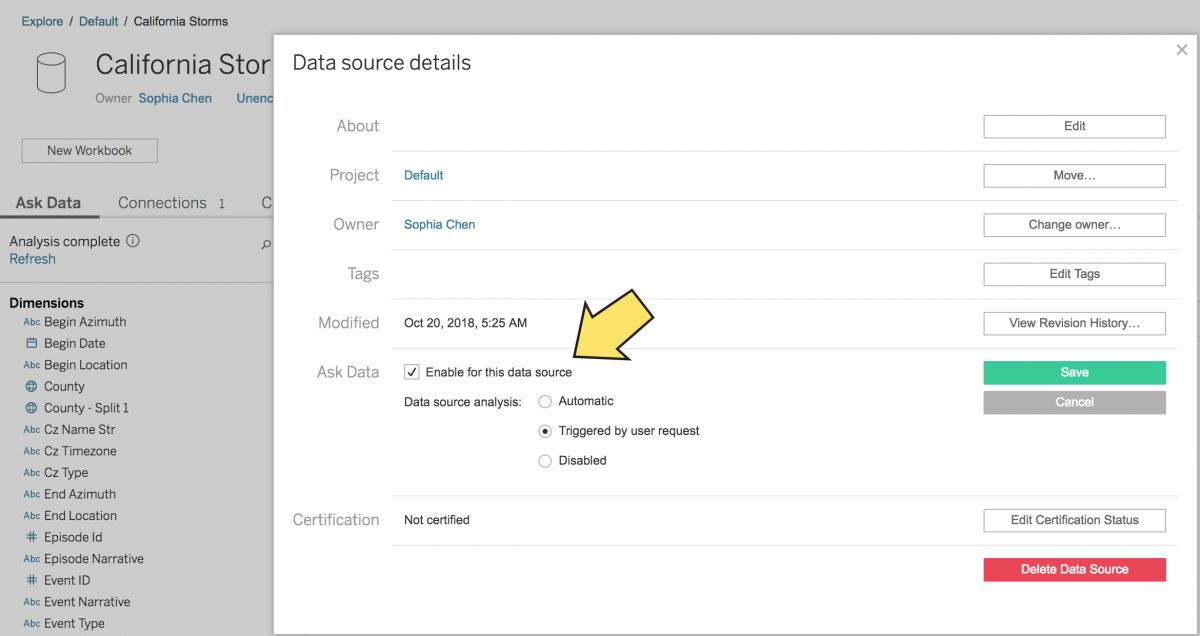
Figure 16: If needed, you can disable Ask Data for certain data sources in the data source details section of Tableau Server or Online.
Ask Data offers the potential for everyone in your organization to ask questions of their data. Following these data curation guidelines will help you prepare your data for an ideal user experience using natural language.