
Best practices for tidy data using Tableau Prep
Data can be generated, captured, and stored in a dizzying variety of structures, but when it comes to analysis, not all data formats are created equal.
Data preparation is the process of cleaning dirty data, restructuring ill-formed data, and combining multiple sets of data for analysis. It involves transforming the data structure, like rows and columns, and cleaning up things like data types and values. The speed and efficiency of your data prep process directly impacts the time it takes to discover insights. Understanding the scope of data you’re analyzing and seeing the changes you make to the data can accelerate the entire process.
Think about your data holistically
Before you get started, it’s important to think about how people will use the data that you’re preparing. Understanding this context will help you determine which data set to use, how much data to bring into your data prep tool, and how to ultimately structure and shape the data. To get started, you'll need to answer some basic questions:
Who is doing the analysis?
Consider the end users of your final data set. For example, are you the sole user that will access and understand all parts of the data for thorough analysis? Or will the data set be used by someone in a different role, like a marketing manager who needs to understand how a particular campaign is performing based on select, identified metrics? If it’s the latter, then you’ll likely want to trim down the data set to only those measures.
Or maybe there is a product code in one data table, but the marketing manager needs to know the product name. In this case, you would join the data and fact tables to get the information. Audience is critical when you're preparing data, similar to when you’re creating a dashboard.
What type of questions need to be asked or answered?
In the data prep process, it is important to understand how people will use the final data set—for complex analysis or for a quick summary. This detail influences the data preparation process significantly, determining both the amount of effort and detail.
You can typically predict the most common questions that people will ask of the data based on your understanding of strategic business priorities, but there will likely be unanticipated questions that pop up. When you're preparing a data set, there’s a balance between serving the immediate questions and allowing for further exploration. For example, someone may see a sales trend during the last six months, but digging into a spike during a particular week requires deeper analysis and a daily granularity of the data.
Where does the data live?
There are some basic considerations when it comes to this question. For example, do you even have the right permissions to access a given data source and is it in the right shape? In other words, when you bring it into Tableau, can you do the analysis you want? You’ll need to address both of these questions before you even start the preparation process.
To see more about how data should be structured for analysis in Tableau Desktop, visit the online help page.
Once you can access the necessary data, you'll need to determine where it all lives. Ask yourself: Is the data in a single table or in multiple tables in a single database? You may need to combine multiple databases to get to the root of your questions—or if you need a more robust view, you may need to bring in an external data source. For example, you might analyze student test scores in your district and want to see how socioeconomic statuses play a role, so you integrate census data. It is often necessary to pull in outside data sources to get the complete story.
Know the basic structure of your data
Now that you understand how the data will be used, who will use it, and where it lives, it’s essential to understand how it’s constructed. You would never do a home remodel without first knowing the location of your load-bearing walls. Similarly, you don’t want to start data prep without knowing which fields are dependent on or related to each other, how the data was input (i.e. manual versus automated), or the level of detail. Knowing your data structure lets you develop the blueprint before you move forward in the data prep process.
Know what you’re looking at
Before you bring data into a data prep tool, it’s important to understand what you’re working with; you need to know whether you’re looking at the entire data set or only a subset. You may also need to do some data exploration before you start cleaning.
Adjust your sample size
When you connect to a large data set, you’ll probably want to limit it to a sample of the data to increase the speed of your data prep process and to optimize performance. There may be times where you want to see the full data set and Tableau Prep lets you do either. If a sample doesn’t help you solve your data prep task, here are some things you can try:
- Increase the sample size of your data. Go back to the input step and adjust the number of rows for the sample. You can increase the number of rows or include all the data, but be aware this could slow down the performance. Another caveat is that using a fixed number of rows will return what the underlying database uses as criteria for the fastest way to return the rows requested (i.e. this does not necessarily mean the top 1,000 rows in the database).
- Use random sampling. By default, Tableau Prep will calculate the optimal number of rows to return depending on the total number of fields in the set and the data types of those fields. The random sampling happens on the database level, returning the number of rows requested. The database looks at every row and returns a sample. This option is not available for all data sources and may also impact performance.
- Add an input step filter. By adding a filter at the input step, you ensure that the data that is pulled into your data set is relevant to your analysis. This gives you a more representative sample, while helping with performance.
Explore your data
First, you’ll likely want to see the unique number of values in a given field. In the example below, a quick glance at the top of the column header reveals the amount of states represented in the data set. You’ll also want to know how different values relate so that you can spot data outliers or issues. In Tableau Prep, you can use highlighting to discover relationships across fields. When you click on a value in the profile pane, it narrows the data grid view to show the records that have those values in the indicated field. Tableau Prep highlights the values across fields and turns the related values blue.
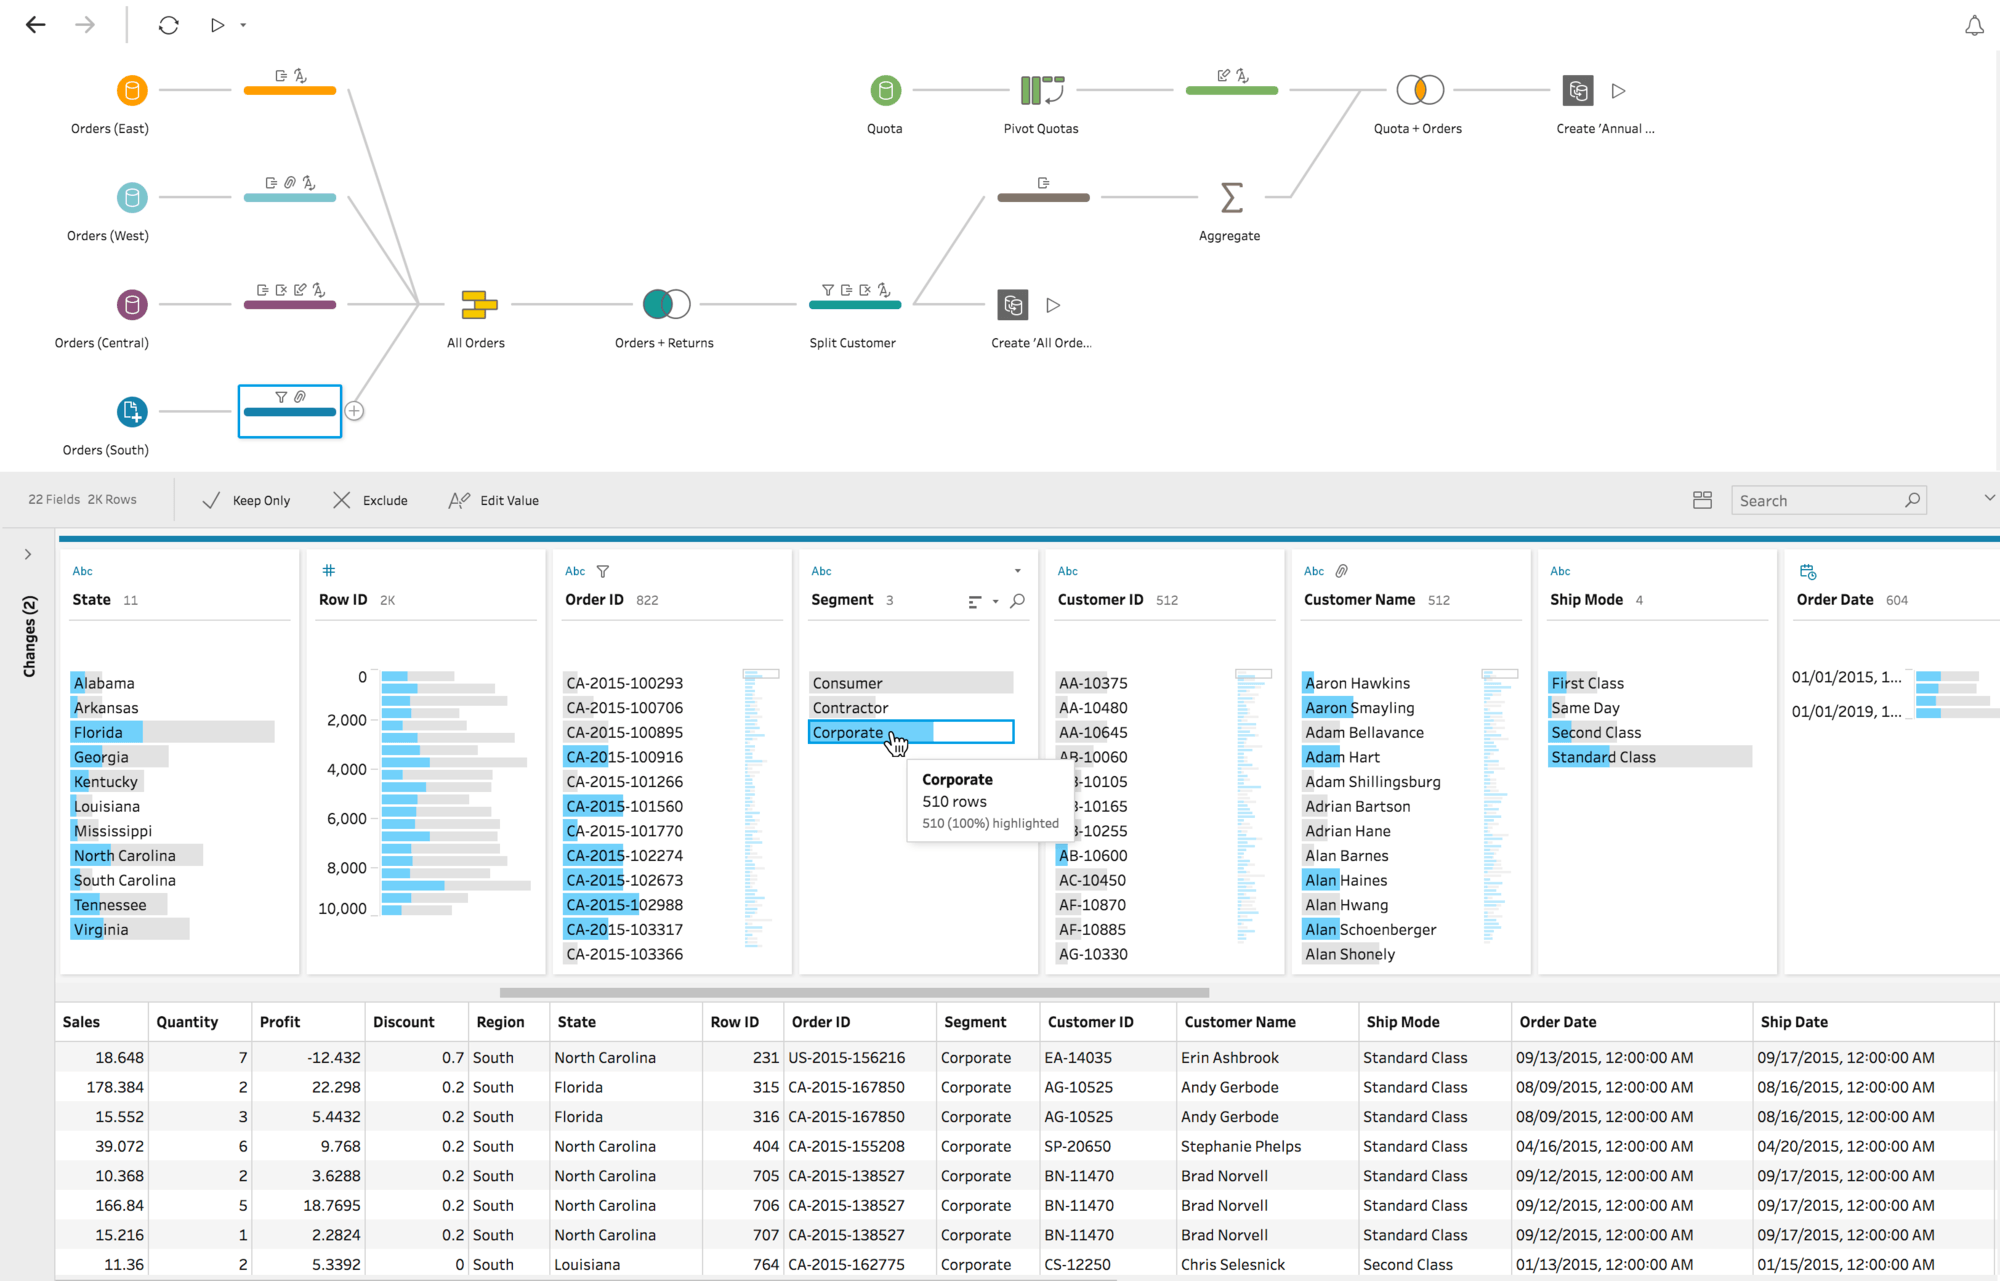
The blue color shows the relationship distribution between the value you selected and the values in the other fields.
Remove unnecessary data
To optimize the overall performance of your data prep process, limit the fields you bring into Tableau Prep to the ones you'll need for your analysis.
Let’s say you’re preparing a data set that represents your company’s sales and product data. You know that you’ll later bring this data set into Tableau to analyze sales performance for the year. In this case, you may not need to include details around the ship date for every product because it won’t tell you much about the sale or why a customer bought the product. It’s only an indication of when the product left the warehouse—so you can likely remove it from the data source. If at any point during your preparation, there is a field you realize you no longer need, you can simply remove the field during your flow.
Hint: While you’re going through your preparation process, you may also start splitting fields, breaking them into multiple columns. You probably don’t need the original column you just split, so go ahead and delete it.
Filtering your data also saves time in the process and ensures you’re doing the right analysis. For example, if you know you only need to look at sales data from the last two years, filter your date field to that time frame with the range or relative date filter. There may be irrelevant or incorrect data that you want to remove. You can simply click on a value in the data pane and exclude it. This can be done at any point in your flow.
Review and clean
In Tableau, your analysis will be impacted by data types—and it is important to appropriately identify each field before diving in. While you can edit aliases, change data types, split fields, and write calculations in Tableau, it’s a lot easier to perform these actions upfront, especially when creating the data set for someone else.
It is essential to understand the data quality for every field. For example, telephone numbers collected from a survey may have various formats—especially if it was from a global pool of people. Manually inspecting thousands to millions of unique values for the sake of consistency is often tedious and error-prone. Identifying patterns and updating the data in bulk has major implications for a cleaner data set. And using Tableau Prep’s built-in functions—like quick clean steps that allow removal of punctuation, numbers, letters, or trim spaces—give you the ability to make these changes, saving you time and sanity.
For instance, if your state field has “California” and “CA” when the rest of the values have the full state names you can change the values directly and voila, the “California” records now include instances of “CA.”
You may also notice your data is mostly right with an occasional exception. Tableau Prep is smart. It helps standardize data values by leveraging algorithms to do some of the heavy lifting. Perhaps you have a column of data where customers input the name of the city they’re from. After quickly scrolling through the column, you notice there are several misspellings for the city of Albuquerque. Rather than update each one manually, Tableau Prep has built-in functionality to group and replace by common characters or pronunciation. These options use algorithms to simplify the cleaning process so you don’t have to. Or, if you anticipate a missing value, you can manually add it for incorporation when running the entire data set through the flow. If you know a field needs to be cleaned or filtered, but requires something beyond what’s in the user interface, you can use a calculation.
Know the ultimate output of your data
When you start preparing your data, it can be daunting to determine how the final data set should look. You may need to combine multiple data sources together or pivot your data from columns to rows so that Tableau can evaluate it properly.
One way to overcome this challenge is to envision what the data pane in Tableau Desktop should look like. Do you have multiple columns with the same value? Should a specific product be its own column with the sales transactions listed below or should all of the products be in single fields and the sales in a separate column? It’s likely the latter, and in this case, a pivot is in order.
If you need to combine two tables, you’ll either be joining or unioning the data. A join allows you to add more fields to your data source—expanding the number of fields that you can analyze. While it’s possible to add a join at any time during your data preparation flow, the earlier you apply it, the sooner you’ll understand the data set and expose areas that need immediate attention.
Similarly, a union will allow you to append two data sets together. For example, you may have an Excel file where each sheet shows transactions for different years. Rather than join the tables together, a union allows you to keep the same structure, but with more rows.
When joining or unioning two tables, consider the level of detail. To properly bring them together, you may need to change the level of detail. If something seems off, try aggregating them.
Keep track of your steps
Staying organized throughout your preparation process is essential when you need to revisit and make a change to some step in the process. While you don’t need to follow a specific set of instructions to clean your data (in fact, you should prepare the data in a way that makes sense to you), your data prep process will be a lot easier to edit and update if you know where you made changes.
Prepare the way you think
Data preparation has a lot of different components, from restructuring to reformatting to cleaning, and you should not be constrained by a specific order. Tableau Prep lets you make changes and updates to your data in a way that fits how you think. While some people may start with pivoting the data first, others may start with cleaning up misspellings or missing data.
Compartmentalize each step
Creating new steps for a specific set of actions keeps your flow nice and tidy. Think of your steps as folders in your filing cabinet—you organize files by their subject, making it easier to find what you’re looking for. Similarly, the steps in the flow should group a set of changes that capture a particular task. For example, cleaning up customer names might involve splitting a field, remapping a bunch of values, and applying filters on other fields to get the right customer segmentation for the output of the data source. When you keep these actions in the same step, you can add a descriptive name to help you understand the flow later on. Not only does this help you, but if you’re sharing the flow with fellow analysts, it lets them find and reference the same actions, giving them a way to easily make any edits.
Keeping track of what happened in any given step is easy. If you make an action that you regret, you can quickly remove or edit it in the change pane.
Use visual feedback
It’s much easier to prepare the data if you can see how it relates before starting your analysis—like the number of rows in a set after a join, or errors like misspellings. Much like Tableau Desktop, Tableau Prep has been built with our mission in mind: Help people see and understand their data.
Data grid
Using the data grid in Tableau Prep is perfect for finding your way around the data. You can see what the data looks like after a change is made and get a glimpse into existing anomalies.

Mini maps
There are times when you think your data is as clean as a whistle, but using the mini map, you notice an outlier or a few missed records. Use the mini map to spot these and make necessary changes.
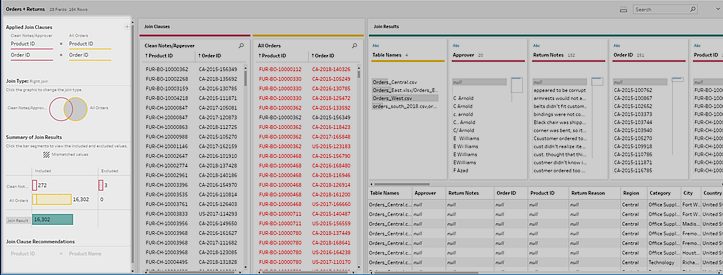
Understand the join
It can be easy to accidentally join the wrong fields together, especially when you're joining on multiple fields. Tableau Prep uses visual feedback to show you the results of a join, helping you discover if there are any outliers, if there is too much data being returned, and whether or not the data is correct.
Keep iterating
Data preparation is an ongoing process. It’s not over once you have corrected all the misspellings or joins. When the data set updates, your questions may change or you may find that you need to add another field. With Tableau Prep’s “Open sample in Tableau Desktop” feature, it’s easy and seamless to test how the data appears down the line in the analysis portion of your journey.
Run the flow and start the analysis
Now that you’ve cleaned, restructured, and filtered your data, it’s time to make sense of what it's telling you. Unlike many data prep tools, Tableau Prep integrates into your full business intelligence platform. Publish the extract to Tableau Server or Tableau Cloud so that others can start their analysis. Bring it into Tableau Desktop to start asking and exploring deeper questions. You’ve just finished the most laborious part of the data analysis process. Now it's time to unleash the fruits of your labor—the insights!