
LEARNING
Data destination—mapping
Tableau makes it easy to understand the “where” as well as the “why”
Make your maps work harder for you
Boost the analytic value of your map
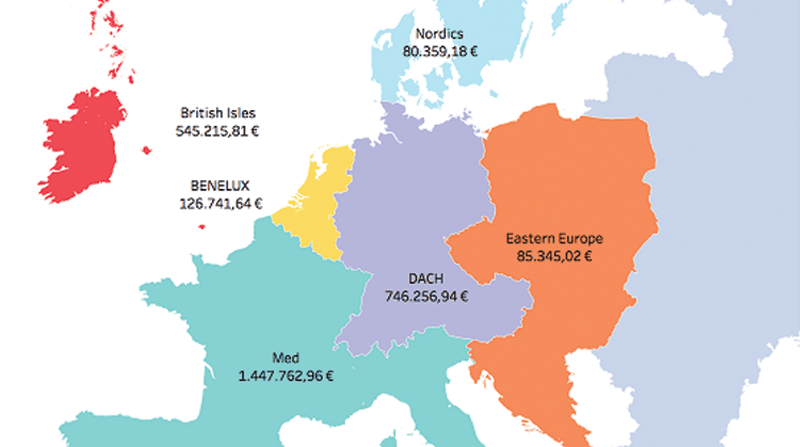
Custom territories
Quickly and easily create the custom geographic areas that matter most for your analysis. Group existing locations in your data like states, postal codes, and countries to make custom territories.
Create your own territories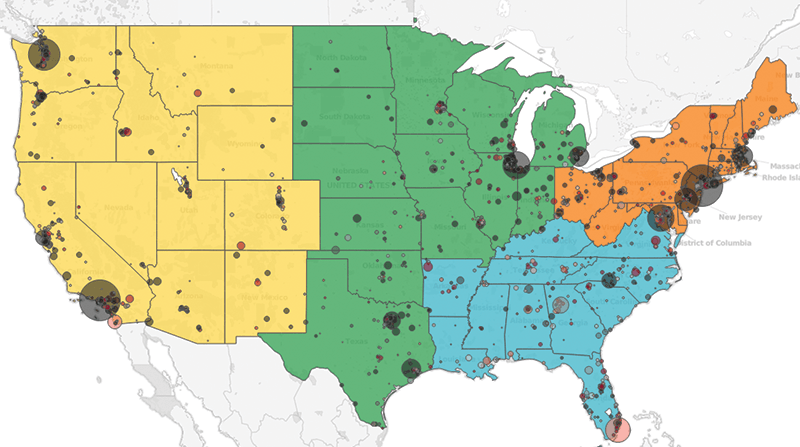
Dual axis
Why stick with one set of marks on a map? With dual axis maps, you can add additional layers of information to your geographic analysis.
Create a dual axis map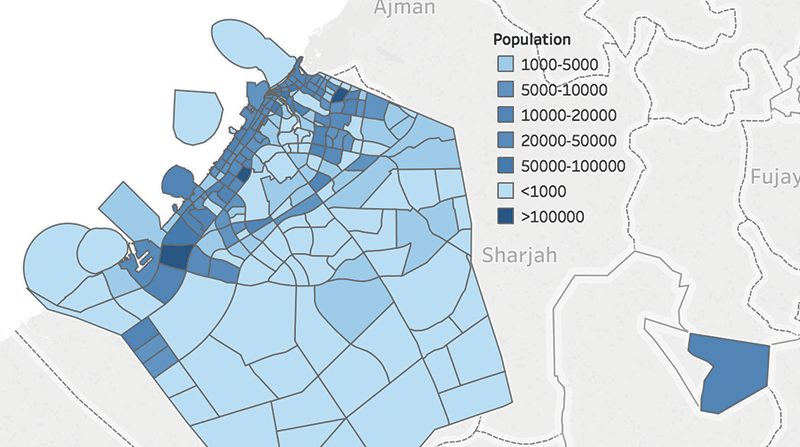
Spatial data
If you have ESRI Shapefiles, MapInfo tables, KML, or GeoJSON files, you can leverage the native connectors in Tableau to map your spatial files for more robust mapping.
Connect to your spatial file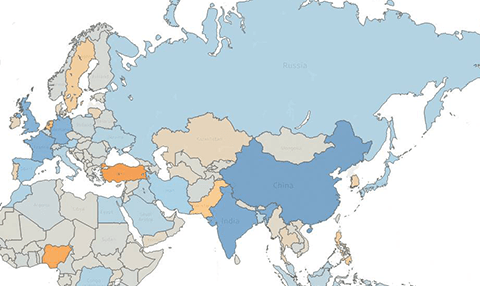
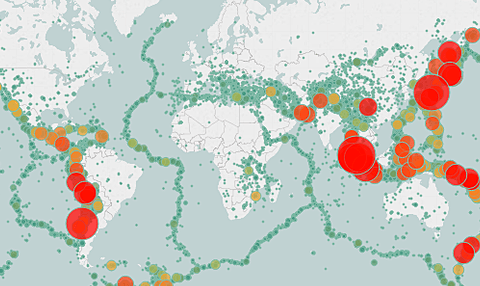
Tableau + Mapbox = extraordinary maps
