Find trends in customer survey data
You have to understand your customers' experience before you can prevent customer service problems.
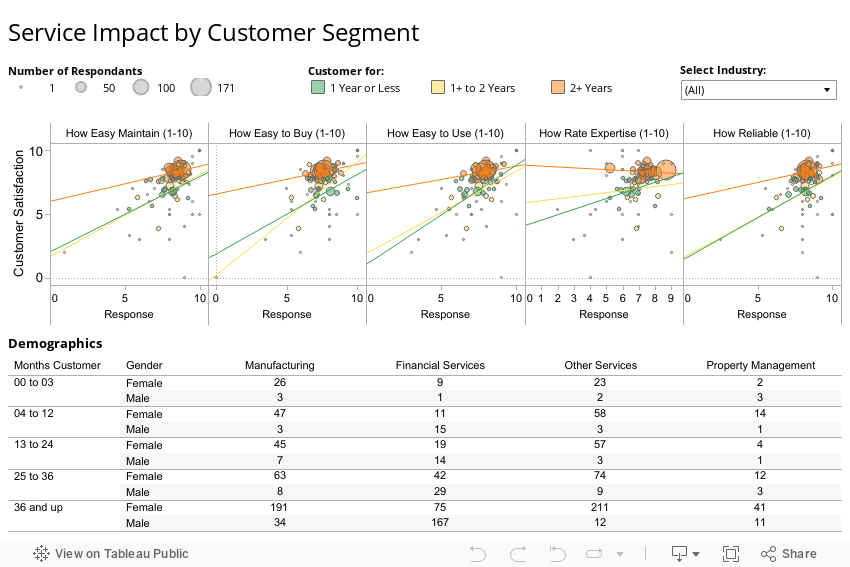
With this dashboard, the user can select an industry to see how different factors affect overall satisfaction, which is displayed in aggregate by the trend lines on the scatter plots. Demographics data is displayed below the scatter plots.
Use the filter at the top of the visualization to examine satisfaction by respondent’s job function and industry.