Combine multiple data sources to optimize physician marketing strategies.
The new pharmaceutical organization has marketing at its core, and there's a heightened strategic need to understand the entire commercial funnel. Physician marketing strategies are a crucial factor, and, with so many disparate sources of data, it can be difficult to see the whole picture and understand where you're over- and under-invested.
With Tableau, you can combine disparate data sources easily, pulling together information about physicians, prescriptions, sales, physician marketing strategies, geography and more to create a clear picture of what's working best.
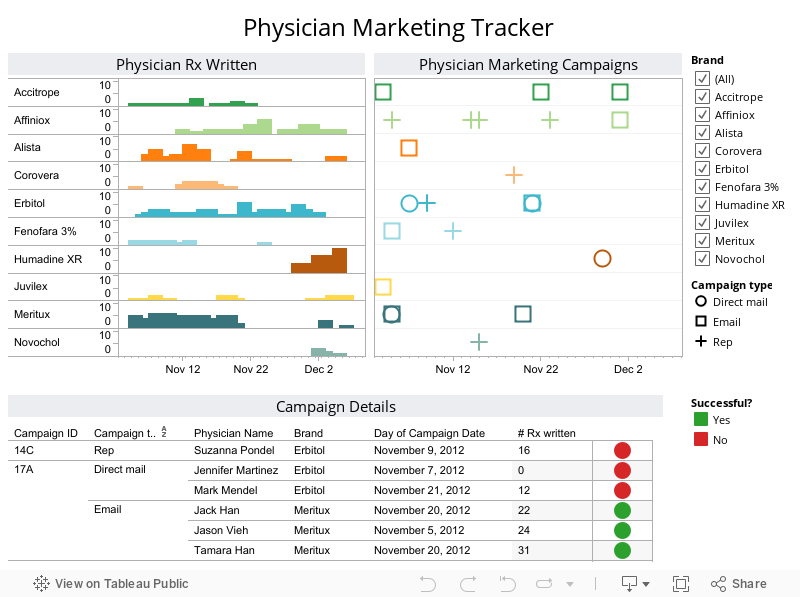
This example blends a data set with physician prescription data with a data set about pharma marketing campaigns for a company with multiple product lines. You can easily see which types of pharma marketing campaigns each product line has launched in the past month and compare that data to when these doctors have written prescriptions, so you can see broad trends. The detailed information along the bottom lists each physician interaction, by campaign, and whether or not it was considered a success. You can use this part of the visualization to better understand physician-specific trends within the larger pharma marketing campaign strategies.