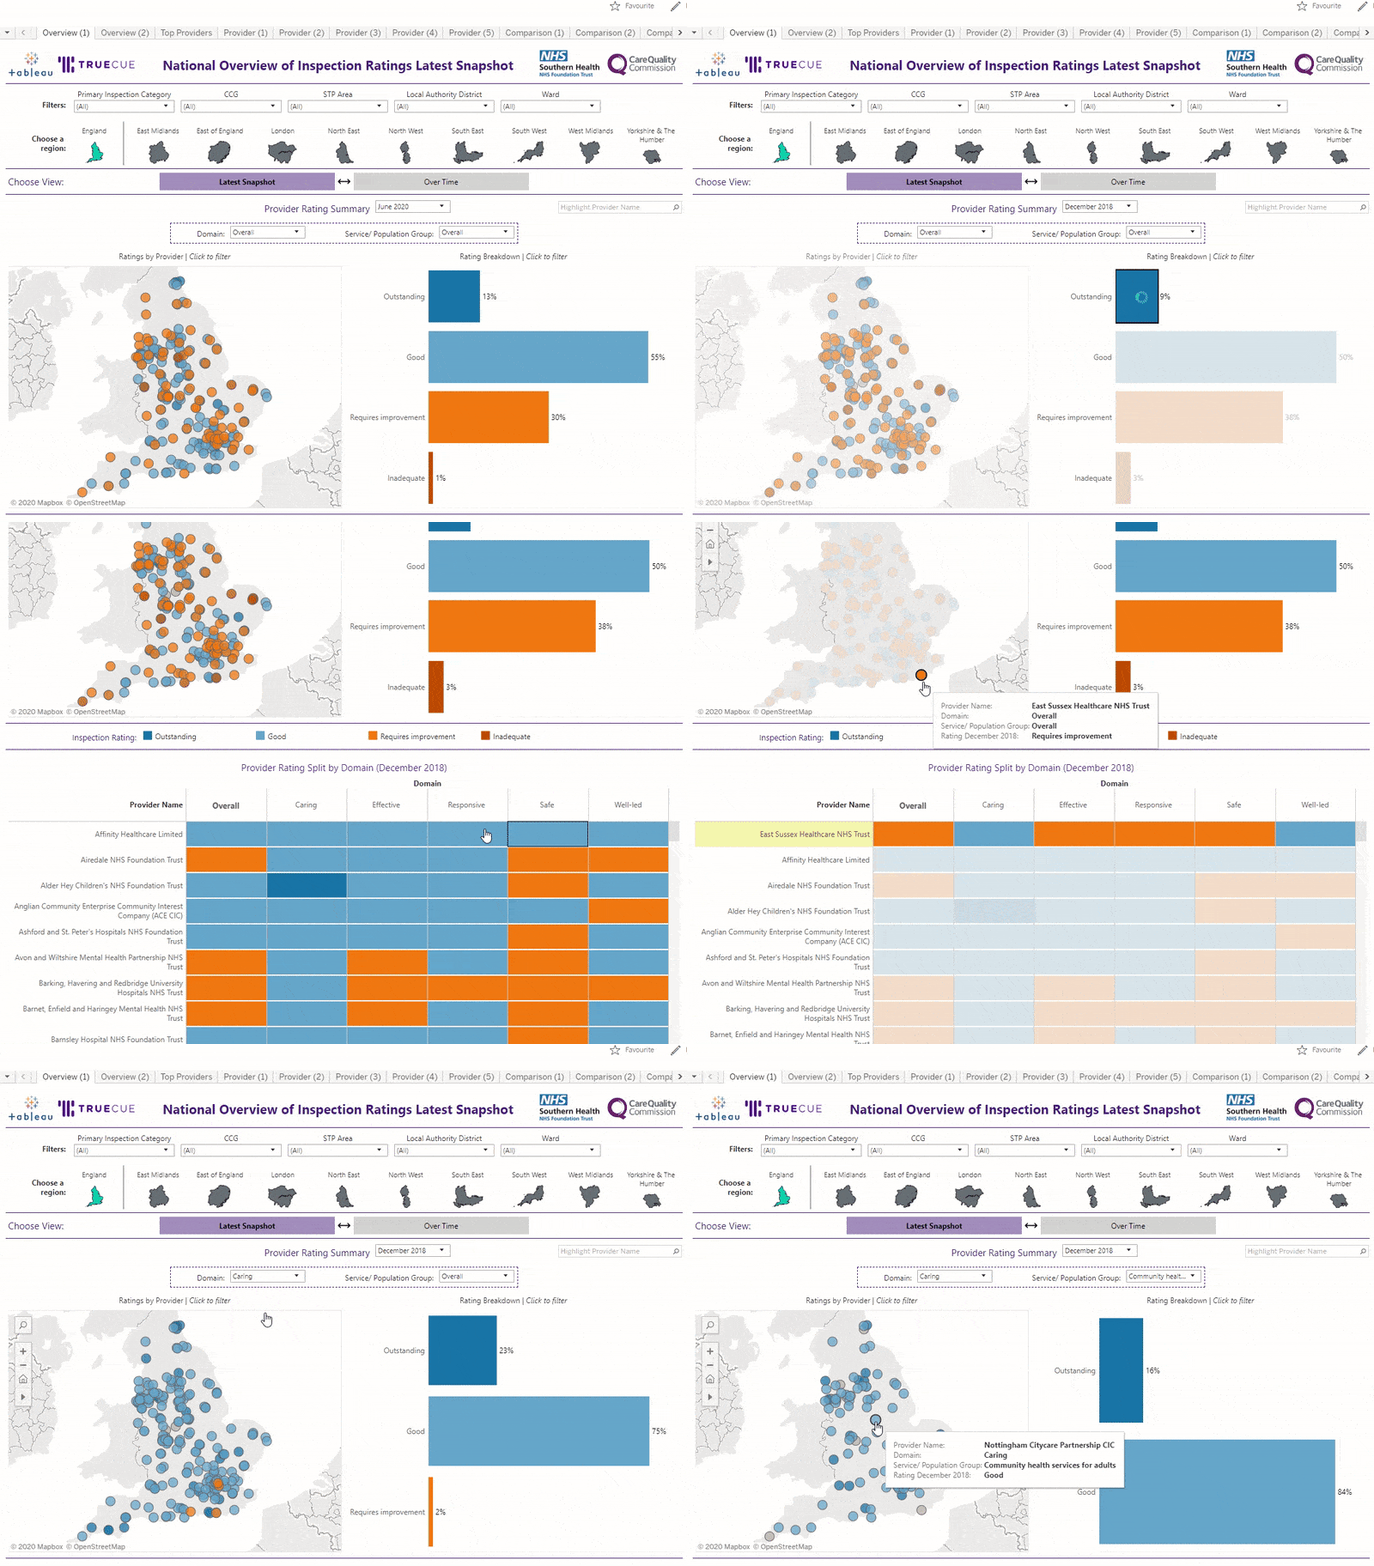
Earlier this year, the CQC (Care Quality Commission) suspended inspections due to the Covid pandemic. Inspections have now resumed and NHS leaders are balancing the management of an inspection and the management of a pandemic. Imagine if you, as an NHS leader, were able to analyse and compare your ratings with those of your peers. What if you could easily identify organisations that are outstanding to enable you and your colleagues to learn from the best practice of other trusts?
NHS trusts often struggle to compare their CQC ratings to a regional or national benchmark and continuously monitor ratings over time. For the first time, our platform provides the latest and historic CQC data and accompanying analysis, updated every month. Want to learn from a provider who has a strong rating in a particular domain?
Join us for this short demo and discover how Tableau can help improve your CQC inspection ratings as we demonstrate the CQC Provider Ratings Tableau Dashboards, developed by TrueCue & Southern Health NHS Foundation Trust. You'll hear directly from Mark Hayter from Southern Health NHS Foundation Trust, who will be sharing the story of how his trust are using the dashboards to identify areas of best practice and to monitor and improve their CQC ratings over time.
This webinar is part of the "Want To..." series. If you missed "Want to Improve Capacity Planning" you can watch the recording here.


