See all of 5.0's features in detail here.
Active Views & Dashboards
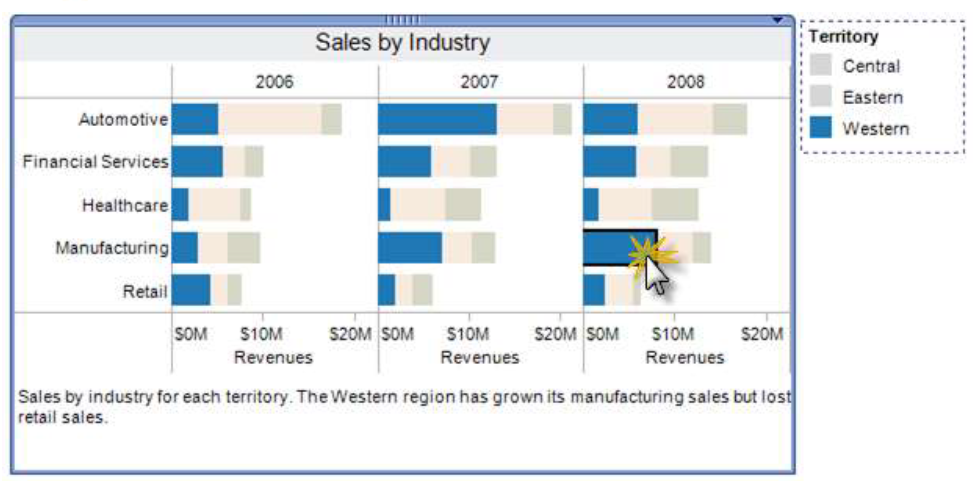
Dashboards combine views to get a big picture of your data. In 5.0, we took dashboards a step further with active interactivity. Take highlighting, for example, which can be applied across worksheets to identify relationships and trends--whether by category, named individuals, date ranges or even a single data point.
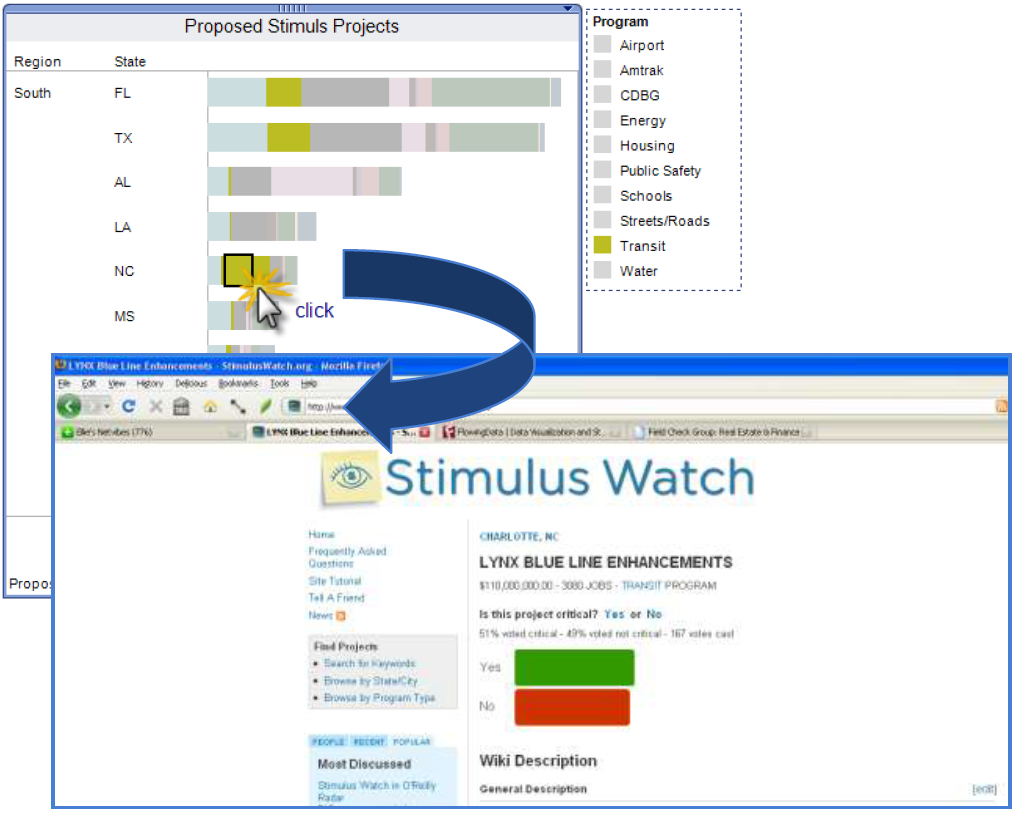
Even individual worksheets on a dashboard can act as filters themselves. Clicking on a point on one sheet filters other sheets to relevant data, opening up many doors for deeper interactivity and faster insights. Actions can even be configured to contain URL links and point to other sites for more information.
Design Analytical Workflows
Rather than just provide static reports, we added a host of new features to create views that guide readers to new insights. There are new filters, such as single-select drop-down menus, search boxes, relative date filters, and more. They can also all be customized--along with legends and tooltips--to inform readers of what actions to take or what information to absorb. Try adding dynamic titles and captions based on viewer selections.
You can even guide viewers from one worksheet to the next using highlighting and filters to move between the sheets. New URL actions also let you lead readers to other sites with more detailed information separate from your data.
And now you can even create dual-axis charts to easily compare multiple measures across dimensions.
Expanded Data Access
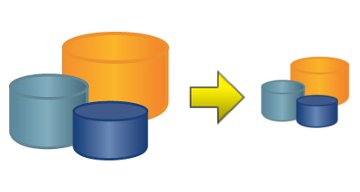
You've got a lot of data sitting around, but only want to work with a small subset of it. With updated Tableau extracts, you can aggregate fields, roll-up dates or filter out certain columns altogether. This reduces the size of the data you import, making it much faster to work with.
Even connecting data is easier. In fact, it's as easy as copying and pasting--literally. Find interesting data on the web or in an email? Copy it, open Tableau and paste it right in. It's that easy.
Version 5.0 also adds the ability to import your own custom geocoding. There are many types of datasets that don't follow conventional geographic location, and now all of those can be imported and plotted with Tableau's maps. Think airports, congressional districts, store locations--anything to fit the desires of your analytical mind.
Server Improvements
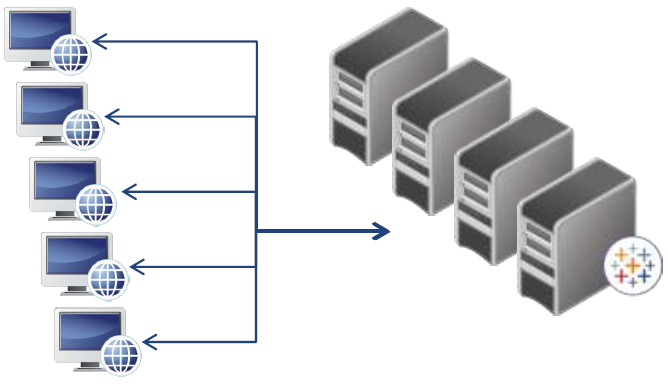
With uses of Tableau Server growing in many organizations, more and more people want access to dashboards at the same time, so we've made Tableau Server capable of multi-threading. Instead of waiting for one request to complete before beginning the next one, multiple users can ask questions of the same dashboard at the same time. This means far shorter wait times.
And in case you find your internal server hardware struggling to keep up with that growth, you can install one instance of Tableau Server and distribute it across multiple server boxes. You're no longer constrained by the limitations of a single piece of hardware.
We've also added the ability to monitor how people are using Tableau Server, giving you the power to optimize it based on your organization's specific use case. When do people access dashboards? Which reports are most commonly used? How much space do they take up? And to help make answering those questions even easier, Server will now create a database repository of its own data, which you can query using Tableau Desktop itself! How people view data is data on its own--now you can analyze it.