Subject Area: Design
Level of complexity: Advanced
Approximate Time to complete: 2 hours
Companion Workbook (twbx): AdvancedTableCalcs.twbx
Additional Resources on the web:
- http://onlinehelp.tableau.com/current/pro/online/en-us/help.htm#functions_functions_tablecalculation.html
- http://drawingwithnumbers.artisart.org/wiki/tableau/table-calculations/
Example 1: Average Sales Over Time
Initial view:
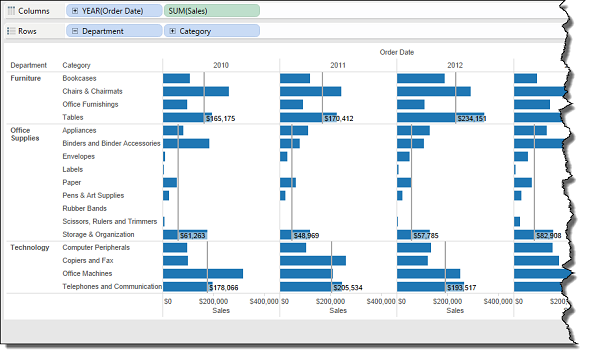
We have a reference line that calculates the average sales within each Department for each year. What we want to calculate is the year-over-year growth in those averages. For example, in Office Supplies for 2011, the YoY growth would be 48969/61263 - 1= -20%.
First, we'll create a calculated field that computes the average Sales within each Department. This calculation is: WINDOW_AVG(Sum(Sales)).
We'll then create our YoY growth calculation that uses this window_avg calculation to compute the growth. This calculation is:
[Average Sales]/lookup([Average Sales], -1) – 1
Once we have written our two calculations, we can use the YoY growth field in the view. Let's put it onto color. Since it's a table calculation, it has to be configured correctly. Each calculation must be set up differently, since they're computing in different directions.
After selecting "Edit Table Calculation…" on the YoY pill, we can specify how the field will be computed. We want it to compute by addressing just the Year of the Order Date field. This will partition off the view by the other dimensions and just lookup the previous average sales by year. We'll also have to change the way the Average Sales field is being computed. With this field, we just want it addressing the Category field.
Here is our resulting view:
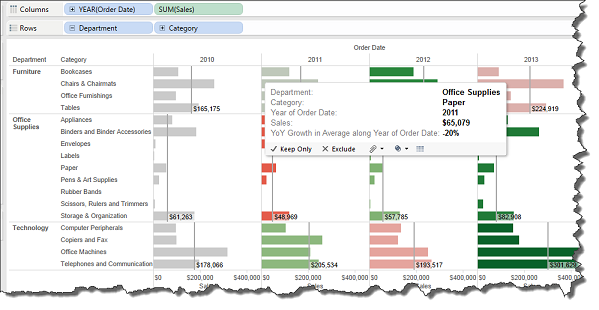
The purpose of this exercise is two-fold. First, it is crucial to understand that table calculations cannot always be written in one formula. Often times the structure of the visualization forces us to break calculations into their underlying pieces. In this case, we have to run two calcs in two different directions to get our desired results. Often times it's a best practice to break out calculations so that things are easier to understand for anyone else looking at the workbook.
Second, it is important to understand that a table calculation that relies on one or more table calculations—YoY Average relies on Average Sales—must be set carefully. Had you right clicked YoY Average, hovered over compute using and selected Table Across, you would have seen results different than what you wanted. One must always ensure that all underlying table calculations are being computed correctly before worrying about the final calculation.
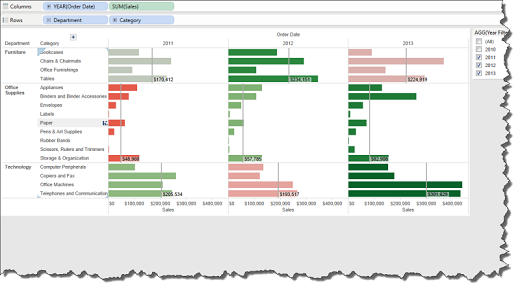
Example 2 – Filtering with Table Calculations
Often times Tableau customers want to hide parts of a view that are being used in a calculation. Using our previous example, let's say that we want to filter on the year of Order Date. If we use the Order Date field to filter, the window average table calculation will break due to the fact that the each year that's getting filtered out will no longer be available to use in the next year's YoY calculation. Give it a try yourself to see.
To get around this, we'll create a table calculation to use as the filter. This gets around our issue because table calculations are done post-query. Our new calculated field is going to be:
lookup(attr(year([Order Date])), 0)
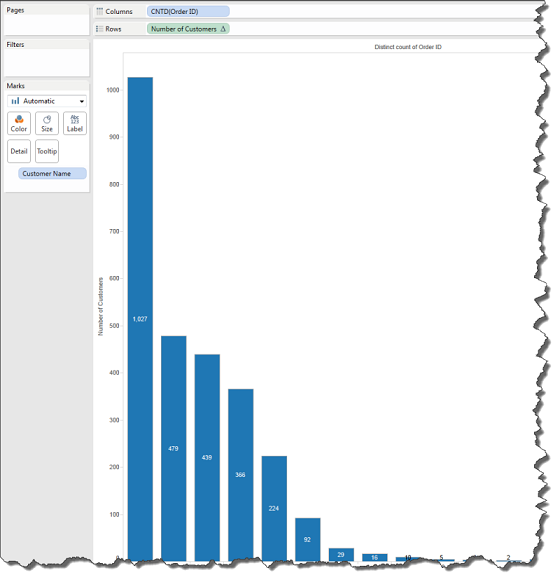
Example 3 – Histogram based on an aggregated field
Creating a histogram based on a non-aggregate field is simple in Tableau with Show Me. However, when we want create a histogram on an aggregation, things get tricky. For example, let's say we want to see a histogram of our customers based on how many orders they've placed. In other words, we want to see how many customers have purchased once, twice, etc.
To get started, right-click drag out Order ID on to the column shelf. Select count distinct as the aggregation level. Change it from continuous to discrete. Put Customer Name on detail. View:
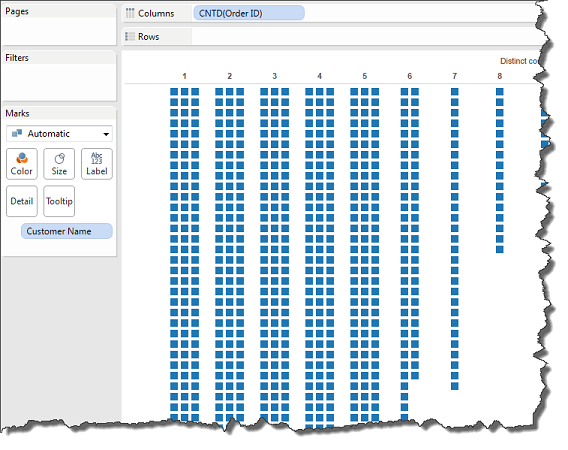
The problem that arises when trying to create this view is that we're going to have a mark for every customer since Customer Name is on detail. We'll use the following table calculation to get around this: if index() = 1 then size() end
This calculations returns the size of the partition (i.e. the number of customers) if the mark is the first in it's partition. Otherwise it returns Null. This allows us to get one mark per order frequency. Put this calculation on the row shelf. For our calculation to work, select the CNTD(Order ID) pill and uncheck "Ignore in Table Calculations". This allows us to partition the view based on the order frequency. Once we change the calculation to compute using Customer Name, we should have our histogram. Turning on labels allows us to see each order frequency: