DataFam Roundup: August 8-12, 2022


Welcome! Dig into this week's DataFam Roundup—a weekly blog that brings together community content all in one post. As always, we invite you to send us your content—and the DataFam content from your peers that have inspired you! Find the content submission form here.
DataFam content

Ethan Lang and Maggy Muellner, #TableauTip: Chart Type Series
Dive into content created by the Tableau Community:
-
Tableau兄さん: 【資格試験受験記】Tableau Certified Data Analyst
-
Tim Ngwena, Tableau Tim: Understanding Tableau Server Processes and how they work. - Tableau Server & Tableau Cloud
-
Adedamola Ladipo, Be Data Lit: Using Data to Address Racial Bias in Soccer Commentary
-
Jared Flores, Put Some Prep in Your Step: Sunburst Chart - Tableau Prep Template
-
Vignesh Suresh: How to Viz: Add Labels inside the end of a Bar chart
-
Kevin Flerlage, The Flerlage Twins: Ten Tips & Techniques: Round 5
-
Ethan Lang and Maggy Muellner, #TableauTip: Chart Type Series
Upcoming events and community participation
-
My Tableau Story with Visionary Bridget Cogley: The My Tableau Story series showcases the evolving and inspiring experiences of Tableau Community leaders. In Episode 6, we feature Community leader and Tableau Visionary, Bridget Cogley. Register now to become inspired by her Tableau journey and walk away with tangible actions to help you learn Tableau, grow your data skills, and connect with helpful people.
-
Data Analytics Careers Summit: Discovering Your Path Forward: Join for a unique opportunity to learn how to break into & move up in the data analytics field.
-
What is the #PublicPolicyViz Project? The #PublicPolicyViz project is a Tableau Community Project dedicated to bridging the gap between analytics professionals and policy practitioners. We seek to facilitate collaboration between the two groups through engaging projects. Launching August 2022.
- Stay up to date with the latest and greatest from the Tableau Community. We'll help you along in your Tableau journey, bring your data skills to the next level, and nurture powerful connections.
- Sign up to be a panelist for the 3charts@3 Live: A Mystery Chart Show featuring topics like personal finance, energy, healthcare and more!
- Data Book Club, Summer 2022 Selection: Invisible Women: Data Bias in a World Designed for Men
Vizzes
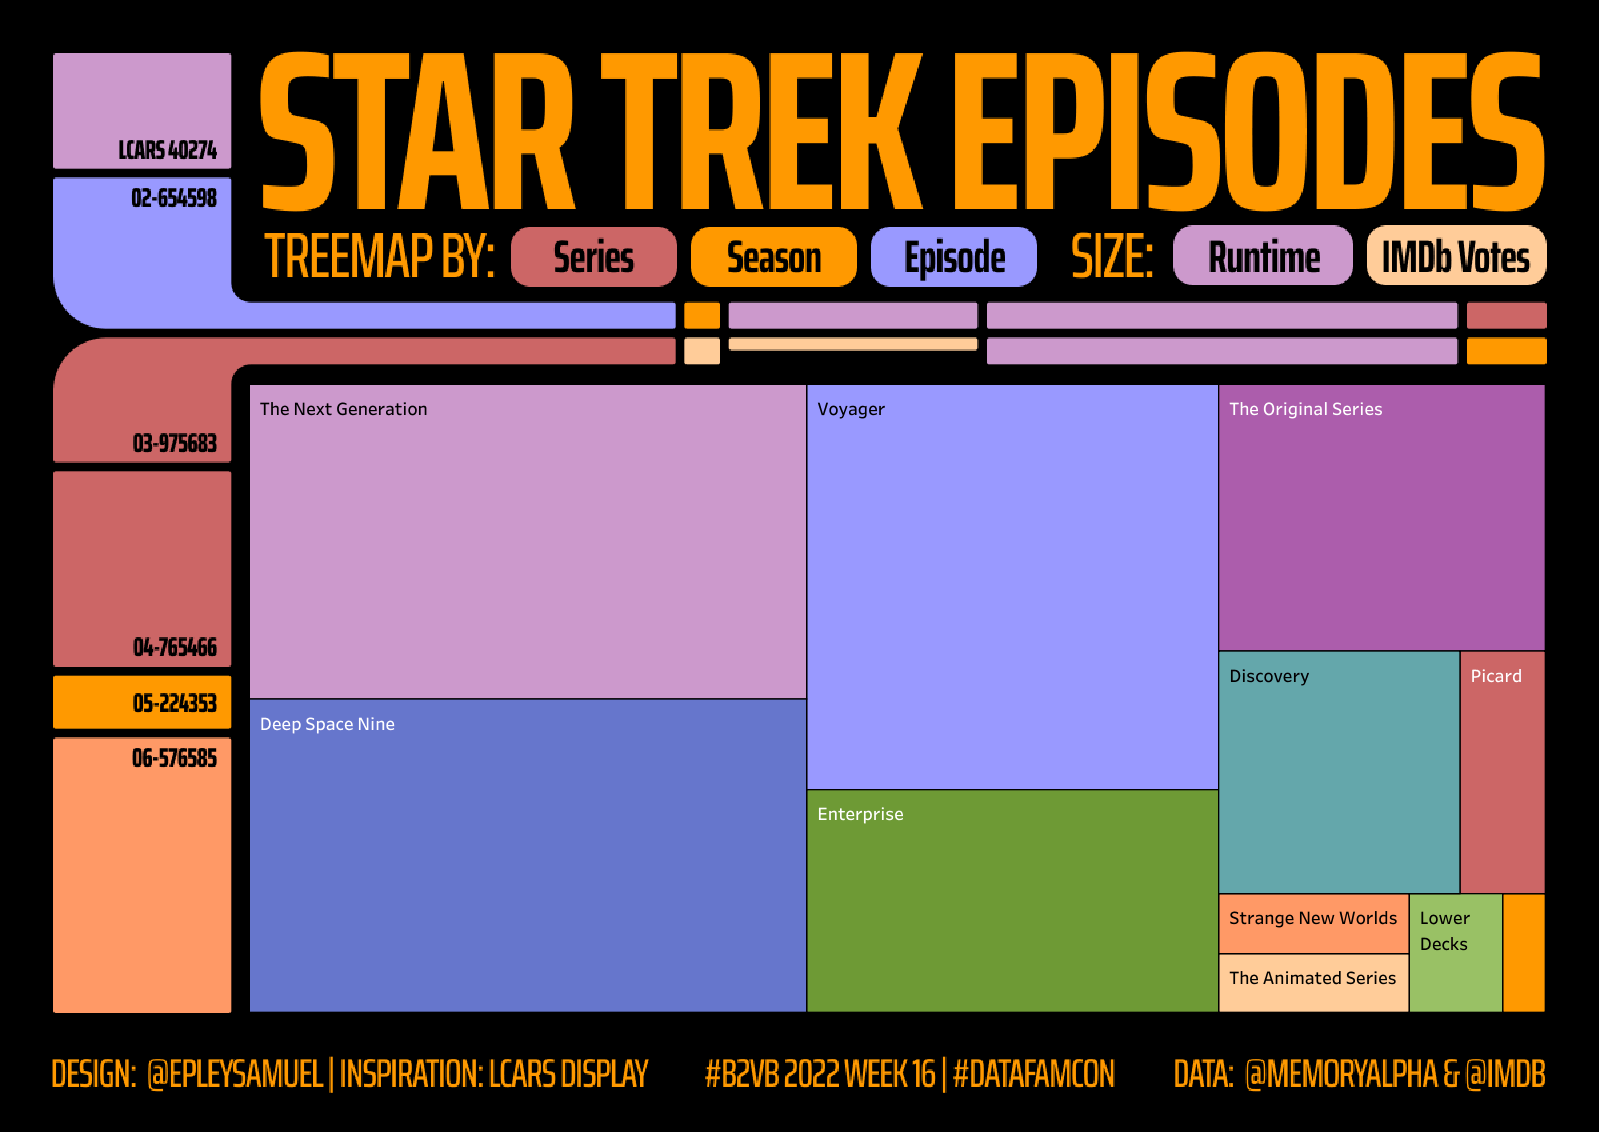
Sam Epley: #B2VB 2022 Week 16: Star Trek Episodes
See the latest Viz of the Day, trending vizzes, featured authors, and more on Tableau Public.
Check out some inspirational vizzes created by the community:
- Brian Moore: The Simpsons - Most Popular Characters
- Sam Epley: #B2VB 2022 Week 16: Star Trek Episodes
Community Projects
Back 2 Viz Basics
A bi-weekly project helping those who are newer in the community and just starting out with Tableau. Not limited just to newbies!
Web: Back 2 Viz Basics
Twitter: #B2VB
Week 16: Build a Treemap
Workout Wednesday
Build your skills with a weekly challenge to re-create an interactive data visualization.
Web: Workout Wednesday
Twitter: #WOW2022
Week 32: Can you build a dumbbell chart?
Preppin' Data
A weekly challenge to help you learn to prepare data and use Tableau Prep.
Web: Preppin’ Data
Twitter: #PreppinData
Week 32: C&BSCo Mortgage Repayments
DataFam Con
A monthly challenge covering pop culture and fandoms.
Web: DataFam Con
Twitter: #DataFamCon
August 2022: Star Trek
EduVizzers
A monthly project connecting real education data with real people.
Web: Eduvizzers
August 2022: Teacher Salaries by Subject in the US August 2022
Games Night Viz
A monthly project focusing on using data from your favorite games.Web: Games Nights Viz
Twitter: #GamesNightViz
July 2022: Nostalgic Games
Iron Quest
Practice data sourcing, preparation, and visualization skills in a themed monthly challenge.
Web: Iron Quest
Twitter: #IronQuest
July 2022: Nostalgic Games
Data Plus Music
A monthly project visualizing the data behind the music we love!
Web: Data Plus Music
Twitter: #DataPlusMusic
July 2022: The Intro
Storytelling with Data
Practice data visualization and storytelling skills by participating in monthly challenges and exercises.
Web: Storytelling with Data
Twitter: #SWDChallenge
August 2022: visualize vacation
Project Health Viz
Uncover new stories by visualizing healthcare data sets provided each month.
Web: Project Health Viz
Twitter: #ProjectHealthViz
August 2022: Mental Health Care Professionals Shortages
Diversity in Data
An initiative centered around diversity, equity & awareness by visualizing provided datasets each month.
Web: Diversity in Data
Twitter: #DiversityinData
August 2022: At the Table
Sports Viz Sunday
Create and share data visualizations using rich, sports-themed data sets in a monthly challenge.
Web: Sports Viz Sunday
Twitter: #SportsVizSunday
July 2022: 150th Open Championship
Viz for Social Good
Volunteer to design data visualizations that help nonprofits harness the power of data for social change.
Web: Viz for Social Good
Twitter: #VizforSocialGood
Real World Fake Data
Create business dashboards using provided data sets for various industries and departments.
Web: Real World Fake Data
Twitter: #RWFD
Session 3: Community Service Requests
SDG Viz Project
Visualize data about Sustainable Development Goals provided by the World Health Organization.
Web: SDG Viz Project
Twitter: #TheSDGVizProject
관련 스토리

DataFam Roundup: April 8–12, 2024
 2024/04/12
DataFam Roundup: April 1–5, 2024
2024/04/05
DataFam Roundup: March 25–29, 2024
2024/03/29
Subscribe to our blog
받은 편지함에서 최신 Tableau 업데이트를 받으십시오.