Behind the Viz: Collegiate athlete Kaleigh Piscioneri uses data skills to visualize her passion for penalty kicks


Get to know your fellow Tableau Public authors with Behind the Viz, a blog series where we explore the people and processes behind our featured vizzes.
KICK IT WITH KALEIGH PISCIONERI Kaleigh grew up in Cleveland, Ohio and attended the University of Cincinnati. She just finished her Bachelor’s degree in Business Analytics with a minor in Information Systems. During her time as a student, she also interned at the Business Intelligence department of Unifund CCR under the instruction of Jeff Shaffer, Kevin Flerlage, and Dinushki De Livera. Now, she enjoys vizzing both at work and in her free time about sports and women, as she played collegiate soccer.
Kaleigh published her first viz to her Tableau Public profile under a year ago. Since then, she’s spent time developing and honing her data skills. Kaleigh’s determination to learn a new skill paid off, and her recent visualization on penalty kicks was chosen as Viz of the Day.
We aren’t the only ones who have recognized Kaleigh’s work. Her former professor and alma mater gave her a shoutout on Twitter:
Great work, @Kpish3! #LindnerPride
— UC Lindner College (@LindnerCollege) May 30, 2019
Kaleigh has created some captivating visualizations and she’s just getting started! We reached out to Kaleigh to learn about her Tableau Public journey. Read on to learn why she encourages all students to learn Tableau and seek out mentorships.
Let's take a look behind the viz!
How long have you been using Tableau Public?
I’ve been using Tableau Public for around five months. I fell in love with Tableau after taking a data visualization class taught by Jeff Shaffer. After the class ended, I started participating in #MakeoverMonday and publishing my work to Tableau Public. I also just submitted my first Iron Viz entry! My knowledge of Tableau helped me land an amazing internship at a company where I regularly create dashboards to help others in the organization understand our data.
Why did you choose this topic?
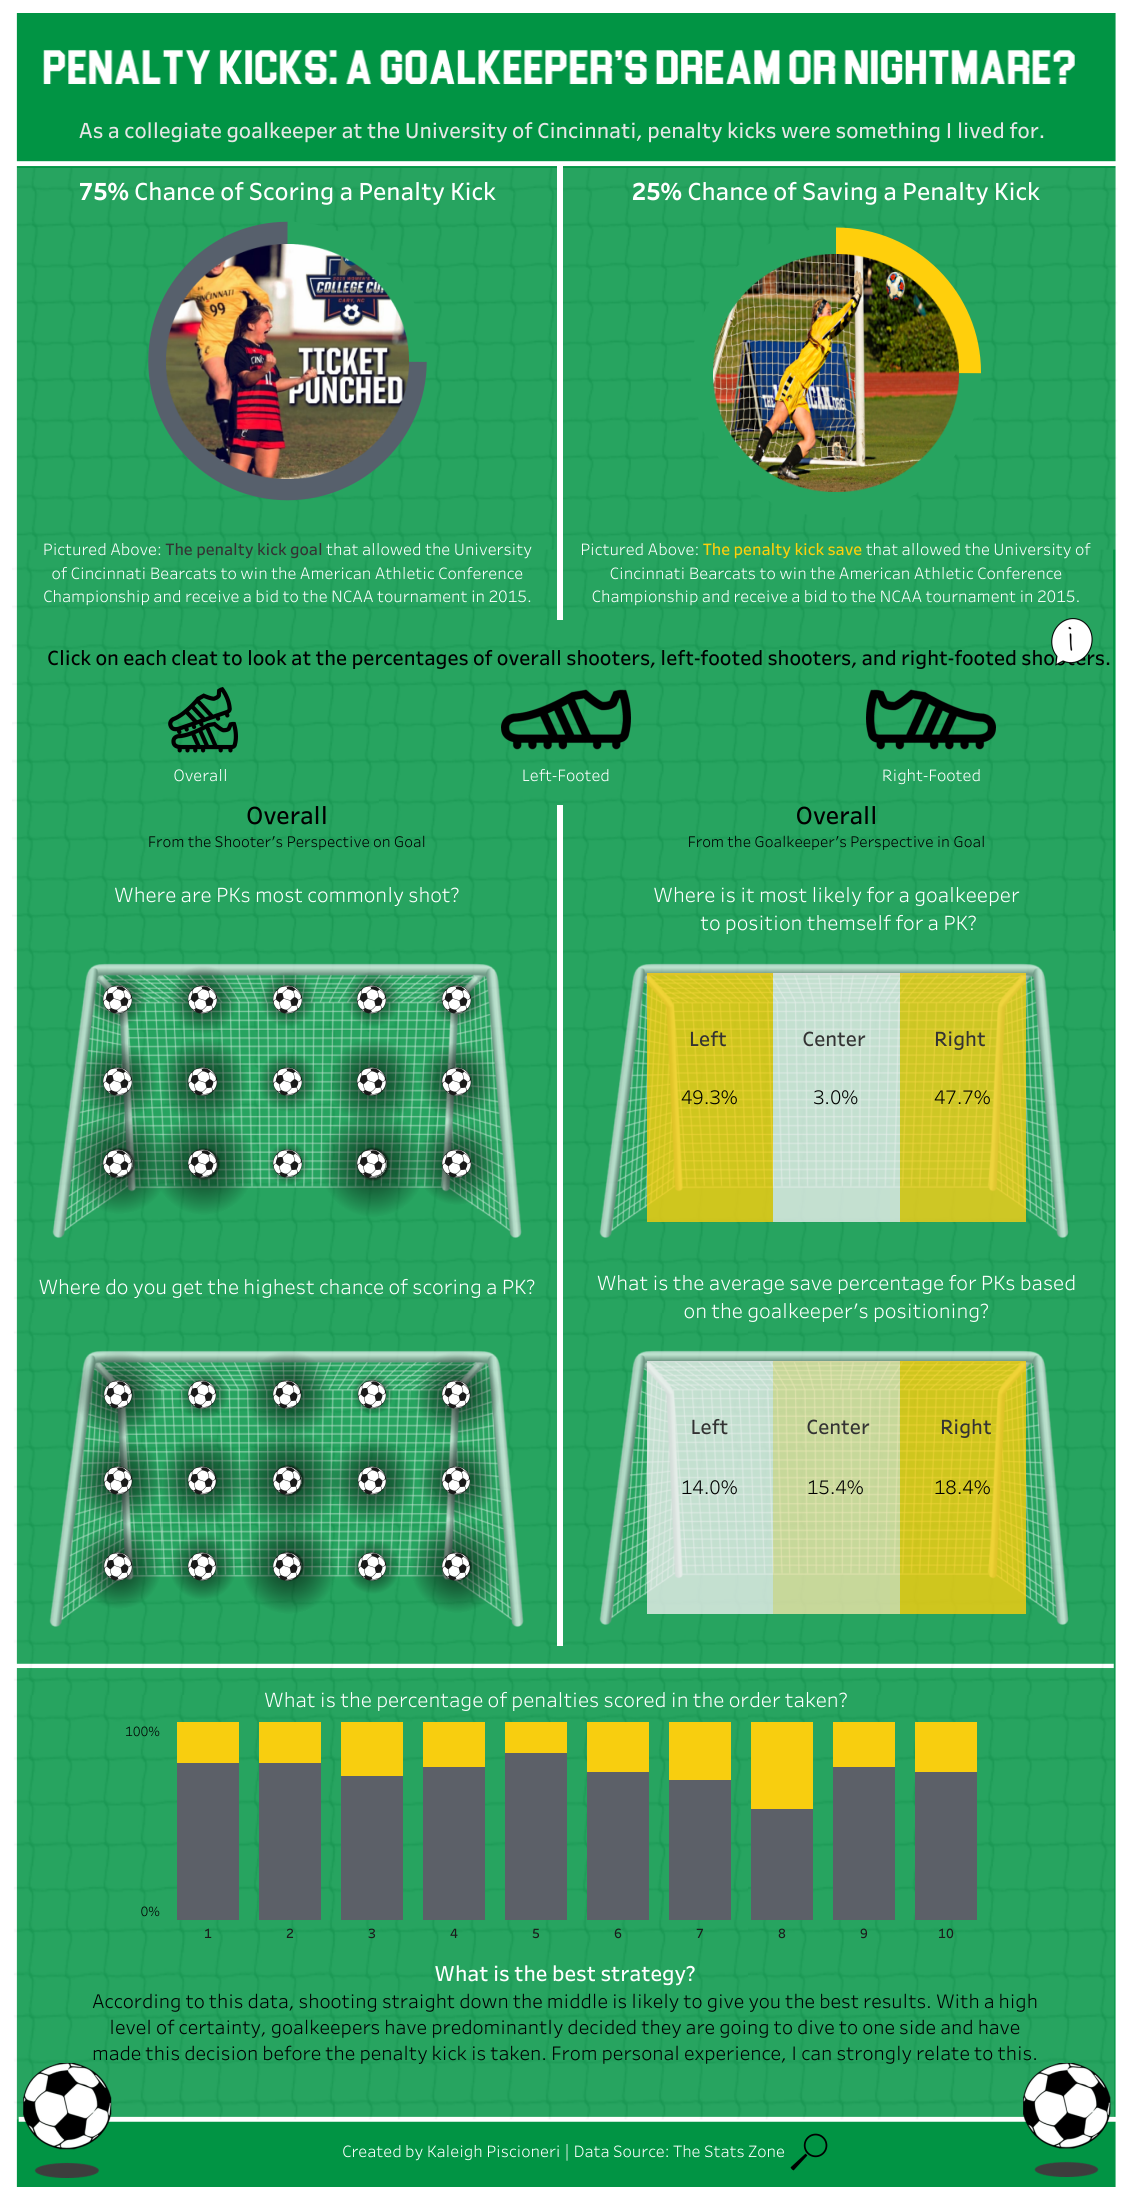
I chose to viz about penalty kicks because I was the goalkeeper in college and thrived under the pressure of a shootout. When I was a Freshman, I saved 3 out of 5 PKs during a shootout, helping my team win the conference championship and earn a bid to the NCAA tournament. I loved to read the body language of shooters to predict which direction they were going to kick. I wanted to look at actual data and statistics about the placement of penalty kicks and the success of goalies during high-intensity moments like shootouts.
What was the hardest decision you made when creating this viz?
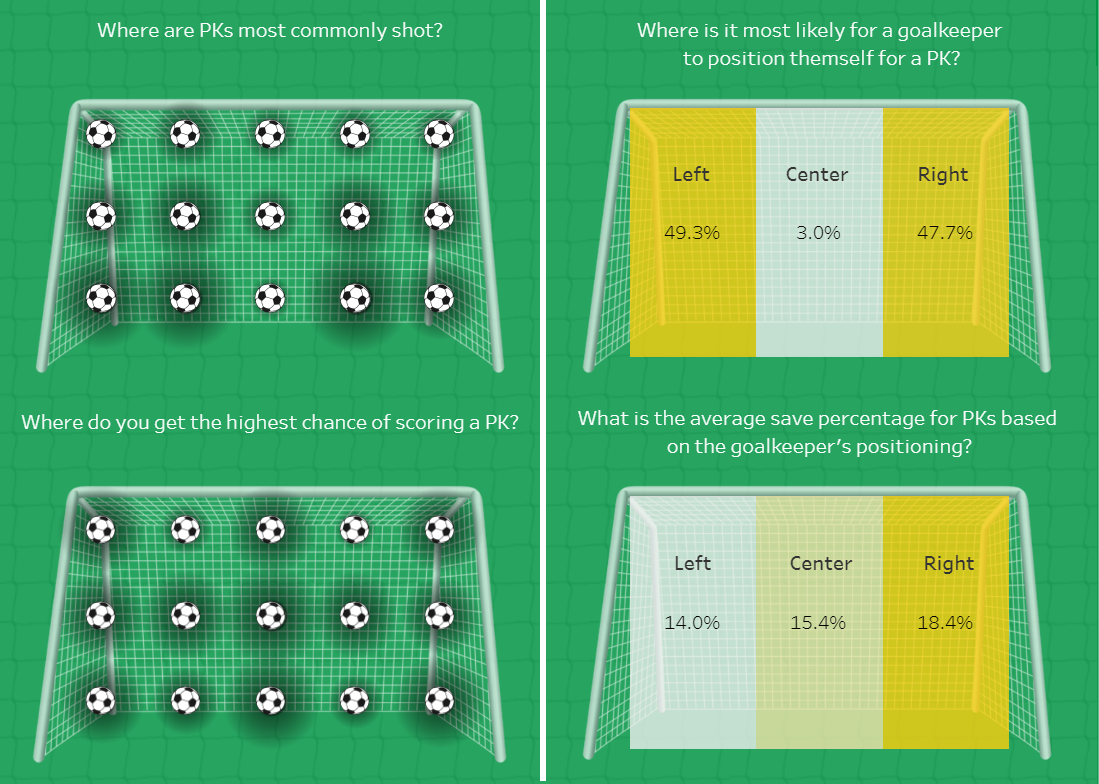
I struggled with how to display the percentages for the four charts at the center of my viz. I originally created four heat maps to display the areas of the net I wanted to look at but decided I could find a better way to engage my audience. My mentor, Kevin Flerlage, suggested displaying soccer balls with fireflies on dual axes. I ended up taking his advice for the shooter’s perspective but kept the heat map for the goalkeeper’s point of view.
Kevin and my other mentors have helped me develop my data skills. It’s incredibly valuable to have a mentor, even if it's just to bounce ideas off of! They can provide a different perspective, offer feedback, and help overcome challenges. I can’t thank my three mentors enough for helping me grow as an individual and professional. I encourage you to get out of your comfort zone and reach out to those you admire. Who knows… you might just find your own professional mentor!
What is your favorite new Tableau trick? How can others use it?
My new favorite Tableau trick is to create and design background images and other graphics in Microsoft PowerPoint. This is a tip that I learned from Kevin. He taught me how to create fun titles as images, create custom shapes and backgrounds, and utilize icons in PowerPoint. You can learn about using PowerPoint for Tableau dashboards in Kevin’s blog.
What is the best music to listen to while vizzing?
I love to listen to country music while I’m vizzing - very relaxing!
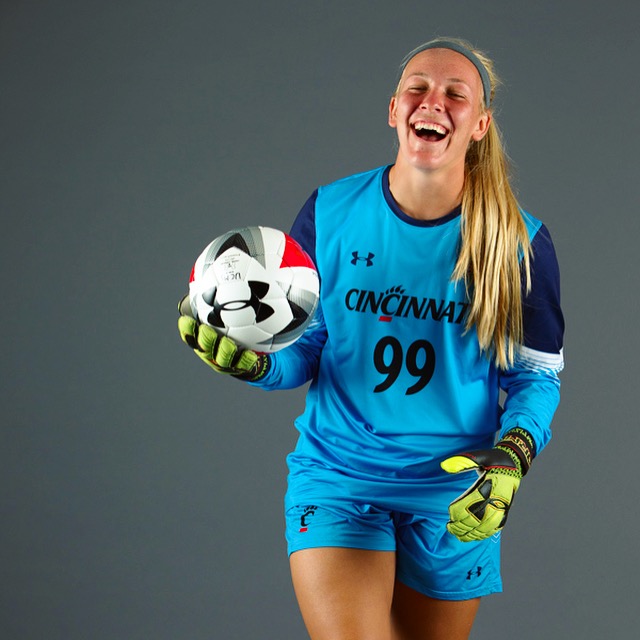
Kaleigh, from the University of Cincinnati, in her goalkeeper uniform
School may be out, but the learning doesn’t have to end! Join the next generation of students developing valuable data skills and request your free student license today.
All of Kaleigh’s vizzes are keepers, so don’t forget to follow her on Tableau Public! You can also connect with her on Twitter or LinkedIn.
관련 스토리

Meet Iron Viz 2024 Finalist Jessica Moon
 2024/04/15

Meet Iron Viz 2024 Finalist Pata Gogová
2024/04/08

Student to BI Analyst, How Tableau Can Lead to a Successful Data Career
 2024/03/20
Subscribe to our blog
받은 편지함에서 최신 Tableau 업데이트를 받으십시오.