Ultimate Survival - My First Ski Adventure


This post is part of our Sports Month series. Merlijn Buit works as Tableau Consultant at Infotopics in the Netherlands.
Hi, my name is Merlijn Buit and I’m a Tableau Consultant at Infotopics in the Netherlands. You may know me from the Solar System Viz of the Day, the Photoshop in Tableau video, the Natural Query Language video.
I’m honoured to be writing a blog for the most active BI community website of the world, so let’s get started!
1. Ultimate survival - my first ski adventure
On March 6th, my colleagues and I went to Austria to ski for 5 days. Those 5 days were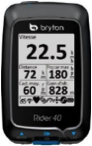 the first time I was standing on those long clumsy things and for me the first days were more about survival than about skiing. In my spare time I’m a fan of biking and I always record my data with a Bryton GPS meter. That’s why I decided to also record my ski (read: survival) activities, so my colleagues could track me when my skis would bring me far away from civilization.
No, all jokes aside or as we Dutch people say: all madness on a stick. I’m always thinking about collecting data and visualising it in a way that everybody can understand. A year ago I became affected by the Tableau virus when I was doing research for the Dutch Police to find the best possible BI solution. Tableau won easily from the competitors and I was immediately sold. Those days I was still a student and had no special connection with tableau. Pretty cool right? Back to skiing. This is my journey and outline for this blog post:
- Ski and survive
- Prepare data in Alteryx
- Create the dashboard
- Publish!
2. Skiing
To be honest, I did not know I was going to write this blog when I went skiing in Austria. If I knew this beforehand, I probably would have tried to ski more kilometres to create a better visualisation. Day 1 was all about learning to go down without losing control. I did some blue slopes and desperately tried to get control of my skis. I’m 1,95M tall so those things are enormous. On day two I was already getting in control with my skis. In my dashboard you can immediately see that I’m getting more control over my skis. I even rocked a red slope (actually, I forgot to turn right and there was no way back to return to the blue slope).
2.1 Personal records
Day 3 was going really well and I started doing some speed record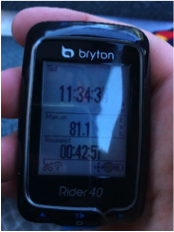 tests with my fellow Alteryx buddy Peter Muller. That day we have put down a speed record of 62km/h. The adrenaline was going crazy and on day 4 we set a personal record of 81.1km/h. Really fast, but man, that was awesome! The last day I also went down from the black slope. It was an easy black slope but I did it! I must confess that my employer convinced me to do the black slope. You can also view this in my dashboard by using the filter on 10-march you can see my two black slope runs (those runs I have only skied once).
2.2 Misfortune
Unfortunately, my Bryton automatically pauses when there’s no movement for more than 10 minutes. Since I forgot to unpause the Bryton sometimes, I missed a few hours of recording and therefore, a few hours of data.
3. Preparing the data
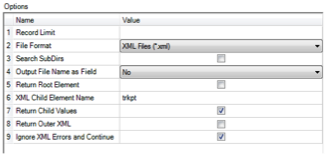
I have prepared the data by using Alteryx 9. Preparing the data was simple, as Alteryx works very well with XML files. The only thing I had to type in was the element name in my XML file. Step 2 involved the modification of the date column. It contains a T and Z to indicate the Time and Date part. With a formula I removed those letters from the column. Part 3 was to union all the different XML files (activities) together. I used the ‘auto field’ function in Alteryx to configure the metadata.
Before I start working in Tableau I wanted to calculate a few more measures directly in Alteryx. The XML file only contains a longitude, latitude, datetime and altitude. With this information I am able to calculate the speed, delta altitude, corrected speed with delta altitude and the duration.
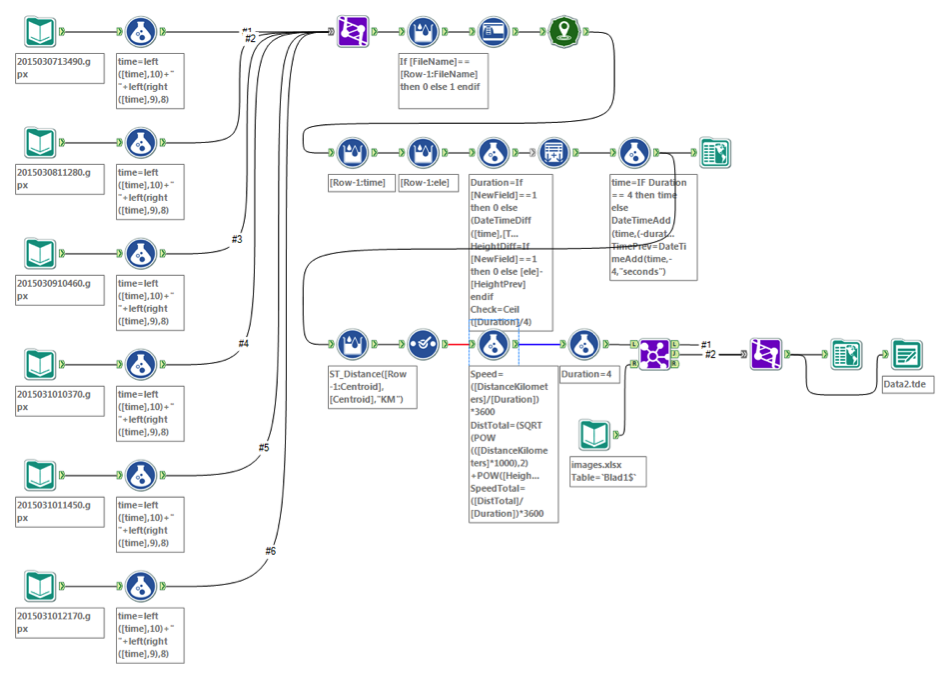
For this I am very thankful with my colleagues at Infotopics who helped me with these challenges. My Bryton generates 1 row of data every 4 seconds. When there is not enough activity the Bryton aggregates rows. For example when I’m resting for 1 minute the Bryton generates 1 row with an average speed, average longitude and average latitude. With the ‘generate rows’ function in Alteryx I generated 1 row with data for every 4 seconds. Now I’m able to properly visualise all my stops in Tableau (and believe me, there are a lot…). Because I unioned my different activities together there are also rows getting generated between the different activities. You definitely don’t want to generate records between the last row on day one and the first row on day two. With an extra check I removed this issue and my data was ready for Tableau:

At last I have added some images and a video to different datetime rows.
Below you can see the process in Alteryx:
4. Creating the dashboard
The last part of my journey is the visualisation. For a Tableau consultant this is the most delightful part. Also by me writing this post means that I have survived skiing!
First I started questioning myself what I wanted to know. I have also asked my colleagues at Infotopics what they wanted to see. I have molded my ideas in a Tableau story, because I think this is a great way to let people understand what you are trying to tell.
PS: I also have added a crash challenge with a bonus video. I hope he/she won’t get mad because I published this :)
You can view the story here:

5. Publish!
Well, and there is my first blog on Tableau Public! I’m very proud to be able to write for Tableau and who knows what will follow? Are you curious for more? Keep an eye on my Tableau Public account.
Thank you for reading!

Merlijn
Tableau Consultant
Email: merlijn.buit@infotopics.nl
Website: www.infotopics.nl
Social: LinkedIn
Public: Tableau Public
관련 스토리

Meet Iron Viz 2024 Finalist Jessica Moon
 2024/04/15

Meet Iron Viz 2024 Finalist Pata Gogová
2024/04/08

Student to BI Analyst, How Tableau Can Lead to a Successful Data Career
 2024/03/20
Subscribe to our blog
받은 편지함에서 최신 Tableau 업데이트를 받으십시오.