Visualizing racial disparities of COVID-19 to create a path toward equity


Author: Channing Nesbitt, Co-lead of Tableau Foundation's Racial Justice Data Initiative
Dashboard Visualization Author: Julia Biedry Gonzalez, Tableau senior solution engineer for the United Nations, member of the Tableau COVID-19 Data Hub team, and Global Philanthropy Chair for Salesforce’s Latinoforce Equality Group
___________________
COVID-19 has affected every person, in every corner of the world. But over a year into the pandemic, the way we understand the virus—through topline data on cases, hospitalizations, deaths, and now, finally, vaccinations—still obscures the deeper stories of the virus’ disproportionate impacts. In the United States, what we’re often not seeing in this broad, summarized data are the unique impacts and challenges communities of color, especially Black/African-American and LatinX, have faced over the course of this past year.
To begin to understand the differences in COVID-19’s impact on racial groups in the US—and to develop solutions—it’s necessary to look beyond the topline numbers to disaggregated, granular, localized data that can offer a clearer, more empathetic picture of the challenges. When we know to look for the hidden stories in data, we are acknowledging that every data point is a person with unique needs and circumstances that must be brought into view.
Elevating examples of this data in action is part of the mission of Tableau Foundation’s Racial Equity Data Hub. The visualizations below show several examples of how to peel back beyond the topline COVID-19 numbers and reach a more nuanced understanding of the pandemic’s varied impacts on communities across the country, and the reasons for these differences.
Tableau senior solution engineer
Julia Biedry Gonzalez, Tableau’s senior solution engineer for the United Nations, member of the Tableau COVID-19 Data Hub team, and Global Philanthropy Chair for Salesforce’s Latinoforce Equality Group, created the dashboards, and we have included the perspective of our partners at the Urban Institute, Boston Children’s Hospital, and Kaiser Family Foundation for additional context.
Disparities in the impact of COVID-19 on race and ethnic groups: Virginia Health Districts
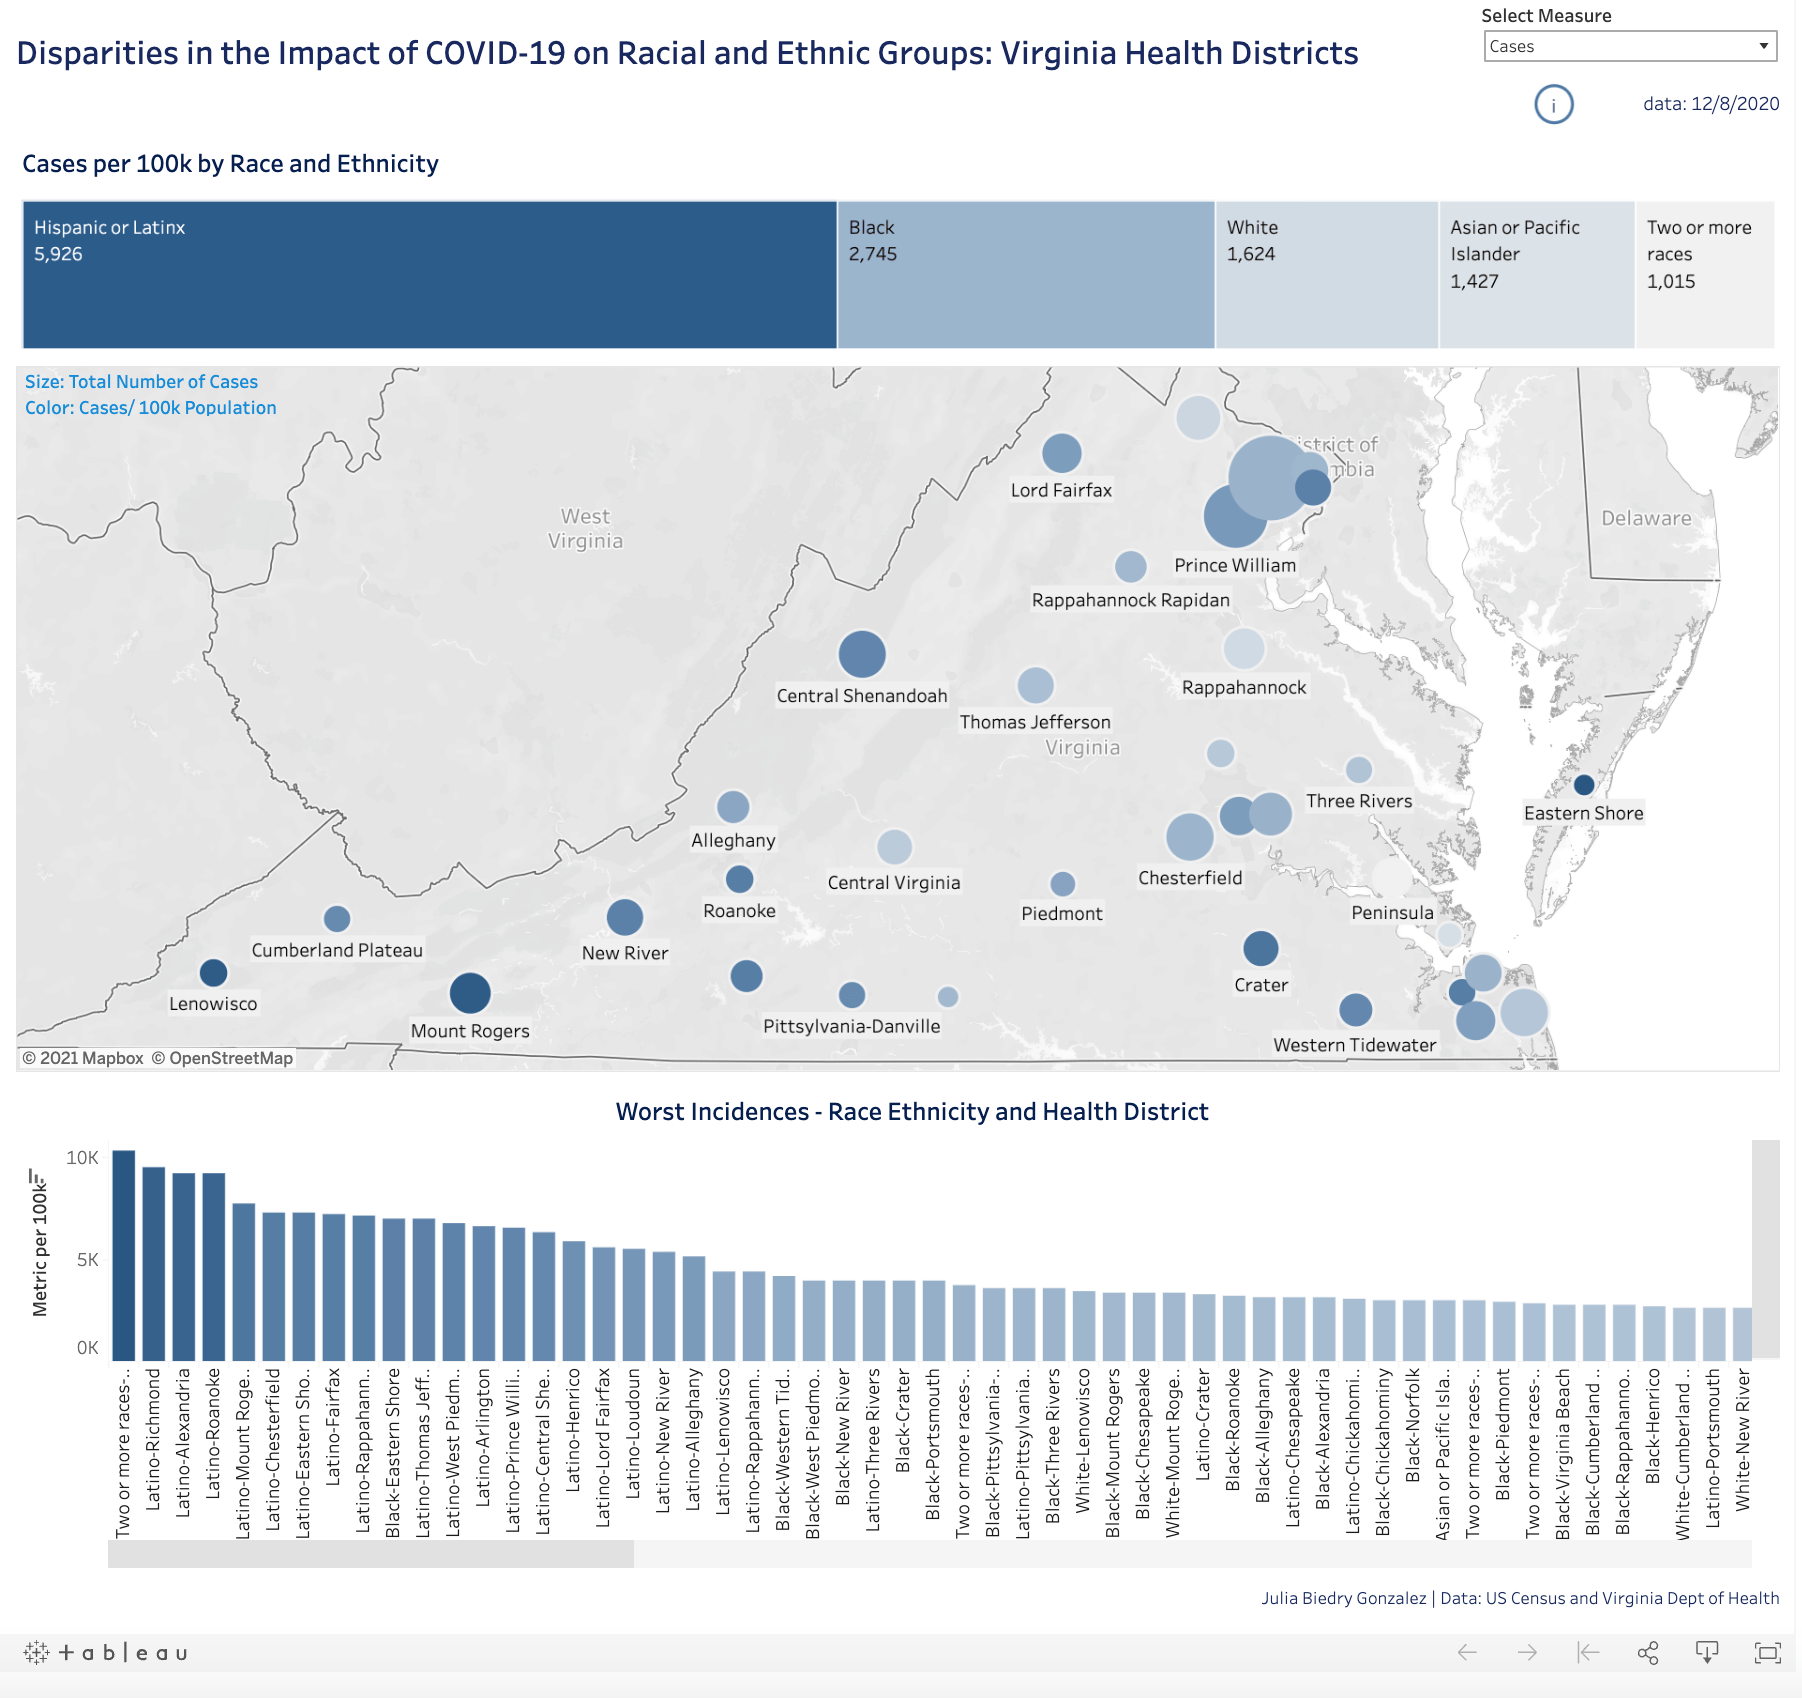
This dashboard shows how a state health department might approach disaggregating COVID-19 metrics by race and ethnicity. Using the state of Virginia as an example, this dashboard shows the different view of the pandemic that emerges when key metrics—cases, hospitalizations, and deaths—are presented by population. Rather than showing overall incidence rates, metrics are divided into population size for each racial/ethnic group to present a metric per 100k view. This is crucial because only by showing relative population sizes can we understand the true scope of COVID-19’s disparate impacts on communities.
With this disaggregated view of the data, we can see that in Virginia, people of LatinX descent make up 9% of the total state population, but have the highest case rates per 100k people.This view of the data also reveals that while LatinX Americans have the highest case and hospitalization rates, Black Americans in Virginia have the highest death rates. “Different metrics reveal different realities for racial and ethnic groups,” Biedry says.
This nuanced view into the data can inform responses to crises like COVID-19. “Comprehensive data by race and ethnicity will be key for understanding the impacts of COVID-19 across communities and on health and economic disparities going forward,” our partners at Kaiser Family Foundation wrote last year. The racial health disparities evident in COVID-19, they added, stem from similar disparities in underlying health issues like asthma and diabetes, and are exacerbated by differences in insurance and access to care, which according to their data is typically lower in communities of color.
A key part of improving equitable access and health overall, says Marlise Arellano, senior strategy associate at Boston Children’s Hospital’s Innovation & Digital Health Accelerator, will be continuing to improve data processes and collection. “Collecting accurate, meaningful data across different demographics, especially race and ethnicity and language data, has been a challenge,” she says. Part of that challenge, adds Jessica Zhang, senior manager for strategy and innovation at BCH, has to do with lack of consistency in the way demographic information is collected, and lack of trust from people of color that providing data will benefit them. “We need to be able to clearly explain the importance of why we are collecting this data and how providing it can help,” Zhang says.
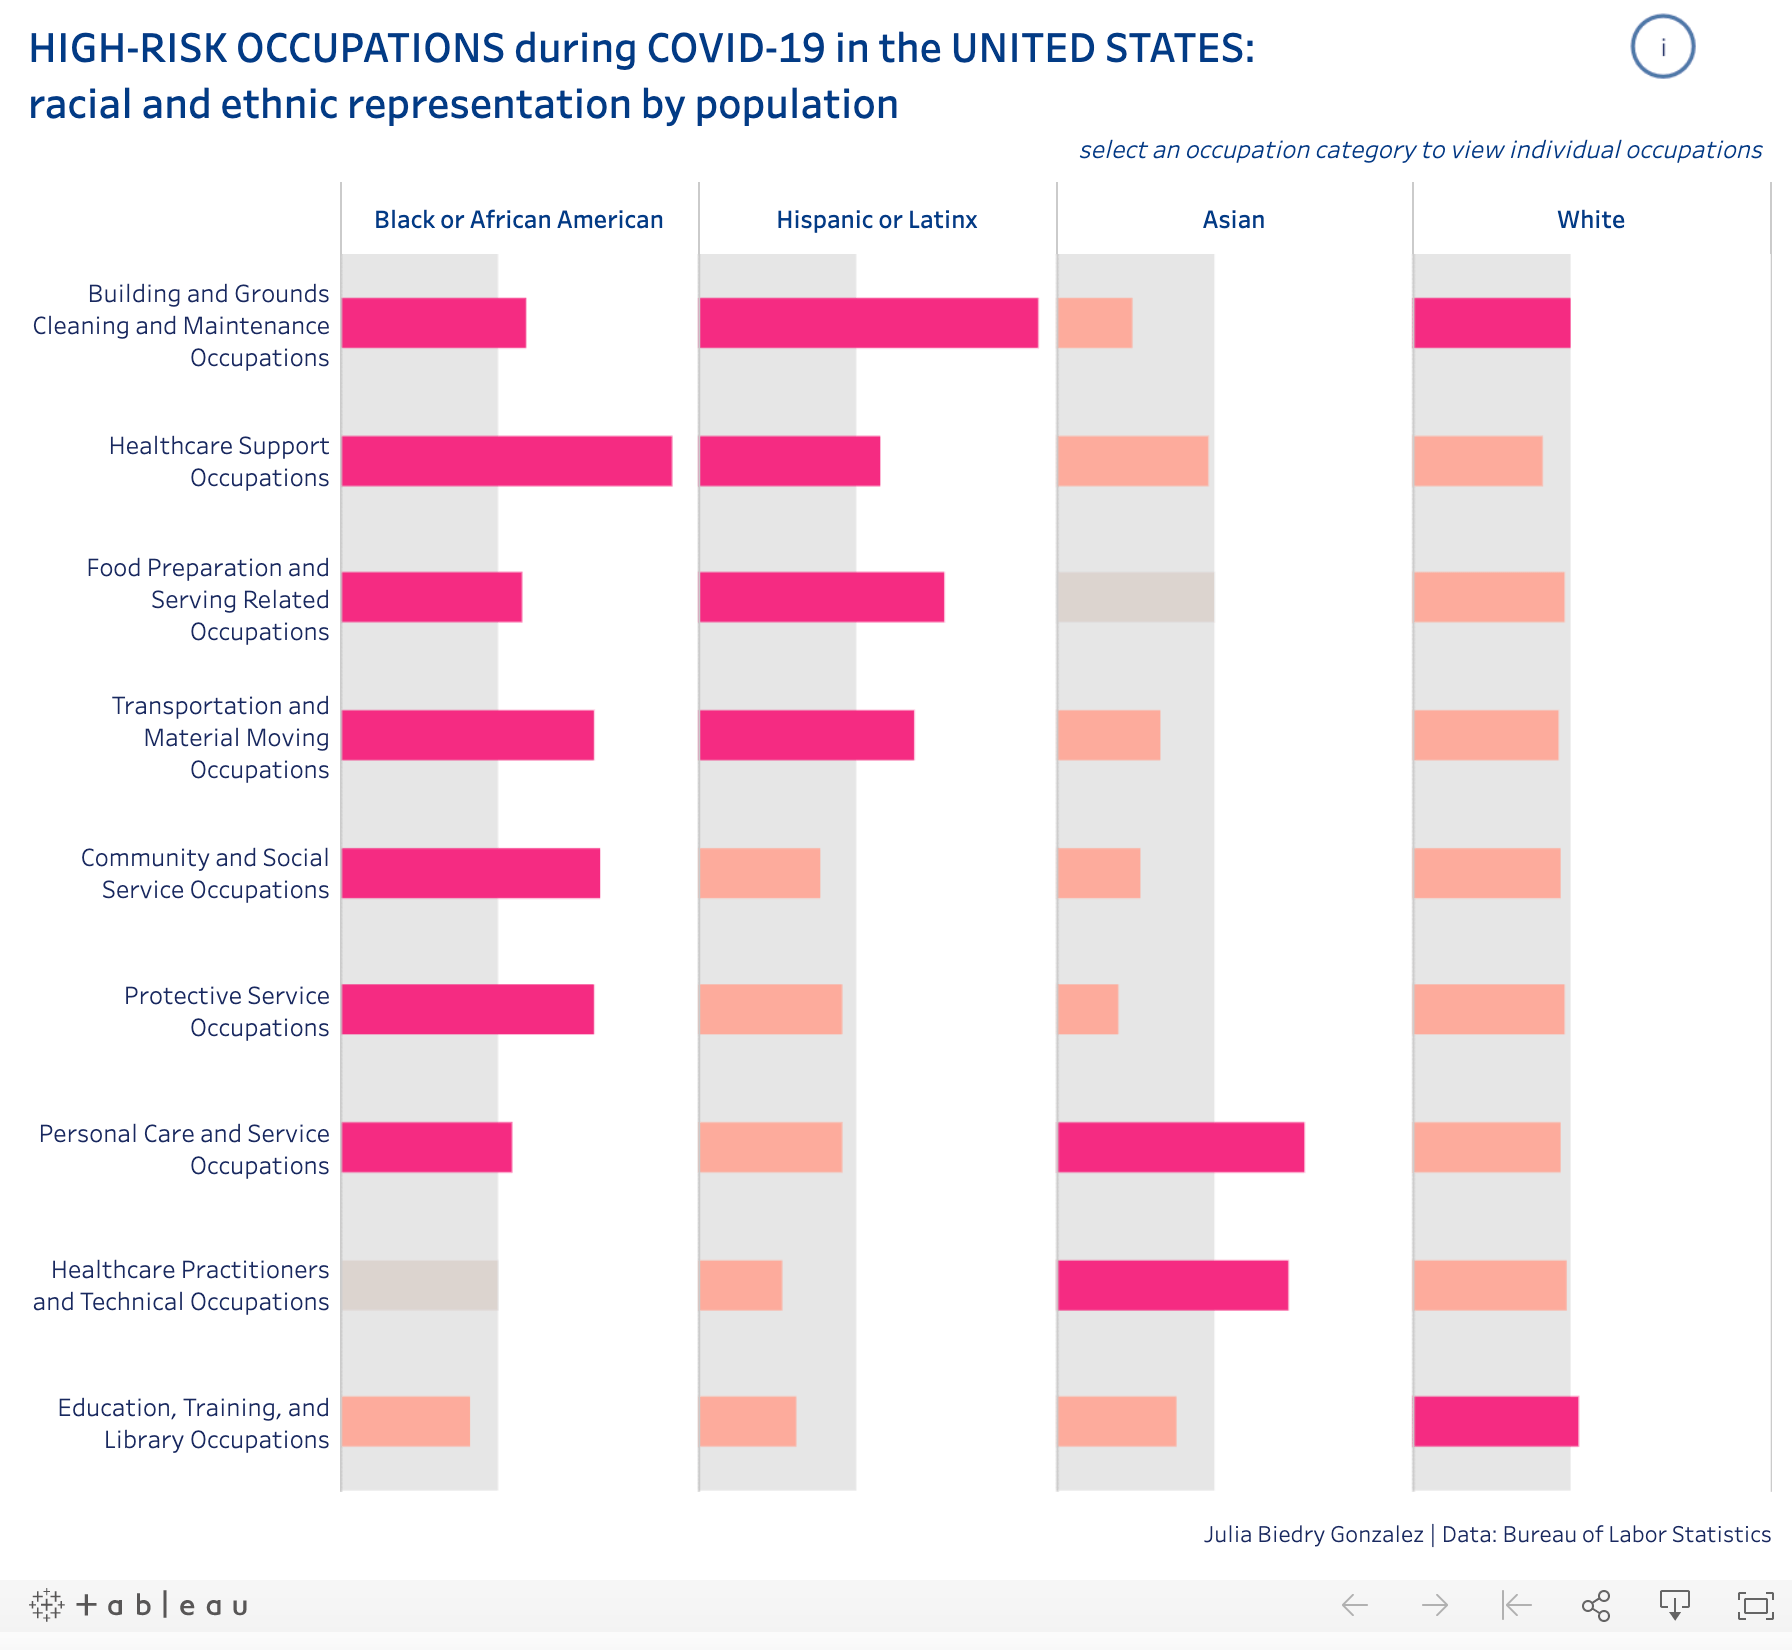
High-risk occupations during COVID-19 in the United States: racial and ethnic representation by population
It’s clear from the data—like those depicted in the previous dashboard—that Black and LatinX people are disproportionately impacted by the virus. But looking at epidemiological data (cases, hospitalizations, deaths) alone does not begin to explain the drivers behind the inequities present in the data. Considering what factors would drive these disparities is critical.
This dashboard on high-risk occupations investigates the potential impact of employment on COVID risk, and disaggregates sector representation by race. For essential workers in fields like personal care, transportation, food service and grocery, and the healthcare sector, isolation and social distancing have proven impossible due to the nature of the work. “As I started to look at the data for the United States as a whole, it is clear that certain racial and ethnic groups are more heavily represented in some of the most public-facing professions,” Biedry says. “The privilege of being able to work from home and isolate can often be impossible for people employed in these professions.” The dashboard shows that primarily Black and Hispanic/LatinX workers are more heavily represented in public-facing professions.
COVID-19, according to our partners at the Urban Institute, has put many families of color in a bind. “Because of structural racism and occupational segregation, workers of color hold a higher share of vulnerable and lower-paying jobs,” they note in their feature on tracking COVID-19’s effects by race and ethnicity. As the virus began to spread, many workers in more vulnerable professions, like grocery store workers and delivery drivers, had to continue to work despite the risks, KFF noted, due to a lack of income stability and financial cushion. And that puts them at increased risk of contracting the coronavirus, which has been borne out in the data on race-based health disparities during the pandemic. Steven Brown, senior research associate at the Urban Institute, noted that “policymakers should work quickly to provide additional relief to prevent the damage of the past few months from solidifying into a more permanent social and economic devastation, and they should do more to explicitly address the challenges facing people of color.” As the chart below will show, this relief needs to be robust enough to address multiple challenges that have intensified during the pandemic.
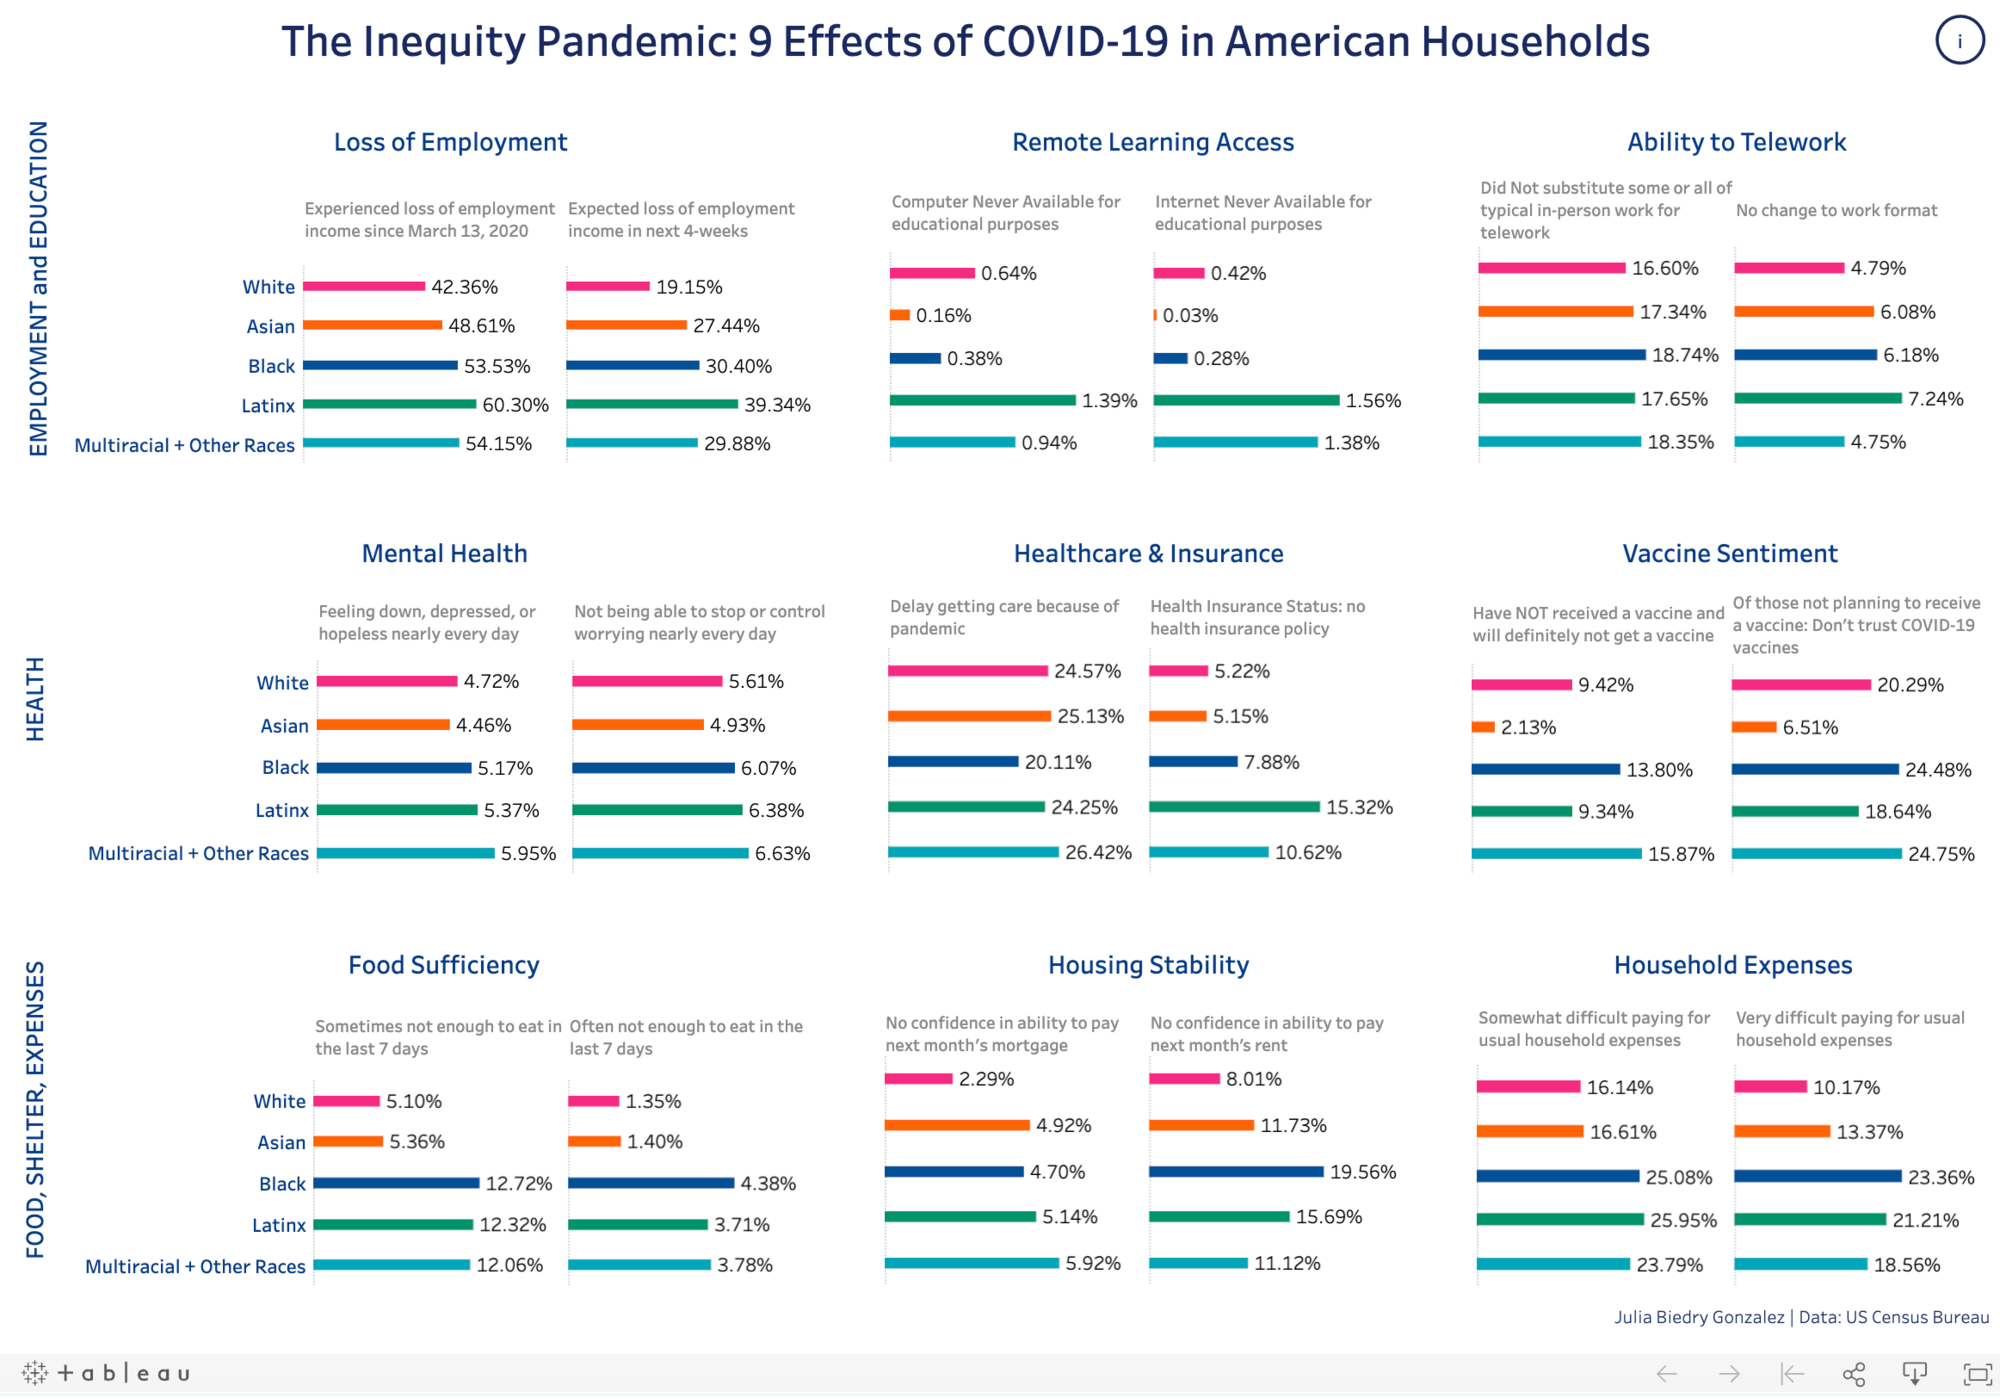
The inequity pandemic: 9 effects of COVID-19 in American households
COVID-19 is a health crisis, but its effects are cascading. To understand the full impact of the pandemic, it’s necessary to look beyond health metrics and to other factors that have impacted quality of life over the past year, from internet access for remote learning to food stability to employment loss.
To create this dashboard, Biedry sourced Household Pulse Survey data at the US Census Bureau to collect data to measure household experiences during the coronavirus pandemic. “I realized that ethnic and racial categories were collected as part of this dataset, and began to conduct an analysis to see if household experiences during the pandemic revealed further markers of inequity in the impact of COVID-19,” Biedry says.
The dashboard shows the varying experience of Black, Asian, LatinX, and multiracial and Americans who identify as other races, and White Americans. What’s evident from the data is that especially Black, LatinX, and multiracial Americans have been affected by COVID-19 related hardships at a greater rate. For example, approximately 12% of Black, Latinx and Multiracial+Other Americans surveyed had sometimes not enough to eat in the last 7 days, compared to approximately 5% of White and Asian Americans surveyed.
Data that looks beyond the immediate impacts of the pandemic is critical for policymakers and nonprofits to consider when planning for assistance and recovery. To design a truly equitable and race-conscious recovery, the Urban Institute noted that policymakers should be addressing race-based disparities, and not taking a one-size-fits-all approach. In a blog post, Faith Mitchell, Fellow at the Urban Institute, noted that unless policymakers act now, the inequities of COVID-19 will be felt for generations. All of the factors outlined in the dashboard above, from the uneven educational outcomes of the past year implied by differences in remote learning, to mental health, to housing stability, will ripple for years. Mitchell outlined several avenues for equitable recovery.
“Congress could consider solutions that address racial disparities in school quality and educational outcomes by reforming the education finance system and giving the federal government greater responsibility for education finance and accountability. Policymakers can also consider steps to reduce the pandemic’s economic effects, such as increasing protection and pay for essential workers, supporting efforts to stabilize renters, improving access to refinancing for homeowners, and establishing a federal jobs program to get people back to work and prevent extended periods of unemployment for people of color.”
Data can not only bolster support for solutions like these, but guide policymakers in where and how to target their efforts to address the most pressing needs, while planning for long-term recovery.
For more examples of how disaggregated data can reveal disparities and point to solutions, visit the Racial Equity Data Hub.
관련 스토리

Using data to drive conversations about climate change
 2022/04/28

Leveraging data to improve forestry practices worldwide

Doing Good Data Means Doing No Harm
 2021/12/13
Subscribe to our blog
받은 편지함에서 최신 Tableau 업데이트를 받으십시오.