From Iron Viz to Tableau: Champion Christian Felix's journey in data


Christian Felix, 2020 Iron Viz Champion, is now a Lead Solutions Engineer in Life Sciences at Tableau. [Christian Felix]
In the history of Tableau Conference, perhaps no other event is as anticipated or revered as Iron Viz. Data lovers from around the world battle it out in the ultimate visualization showdown for the title of Iron Viz Champion. For those who make it as the three finalists, it’s as much about being a data storytelling wiz as it is creating masterful designs.
Last year’s champion, Christian Felix, sums it up best. He says it’s a combination of science and art. Christian won top honors in an incredibly challenging year. Without the roar of the Iron Viz arena crowd, the 2020 finalists had to battle it out virtually. The 2021 contestants will again compete in the virtual space during Tableau Conference on Nov. 10 at 9 a.m. PT.
This year marks the 11th Iron Viz event, and, per tradition, the previous year’s winner is one of the judges for the contest. Christian will sit on the other side judging the finalists as they duke it out for bragging rights and thousands of dollars in prize money for themselves and a charity of their choice. Nearly 900 people have submitted over 1,400 visualizations from 35 countries throughout the history of the competition.
We talked with Christian about his incredible year, which went from Iron Viz champion to joining the Tableau team as a full-time employee.
Molly: Congrats on your 2020 Iron Viz Championship. How has being the Iron Viz Champion impacted your year?
Christian: Thank you! Winning Iron Viz was such a fantastic experience. In general, it has really opened up some amazing opportunities for me to share my passion for data visualization and visual storytelling with others.
For example, I was able to present on creating engaging visuals to the Deloitte Canada Financial team in November of 2020 and the Tableau Solutions Engineers at the Q1 Sales Summit in February 2021. I did a Q&A on data visualization that was featured in my alumni magazine for the Eller College of Management at the University of Arizona, and I recently presented at the Uber Analytics Summit on Storytelling with Data.
Molly: When did you first become aware of Tableau?
Christian: I was a student in the analytics program at Texas A&M. Tableau wasn’t part of the curriculum, but leveraging the software made a lot of my statistical exploration work so much more efficient, productive, and enjoyable. It became my go-to tool for visual exploration and analysis prior to modeling.
Molly: How did you learn it?
Christian: Initially, I taught myself, starting in 2013. The free learning videos from Tableau combined with the willingness of the Tableau Community to engage with newcomers in the forums and online was enough to get me up and running. Eventually, I ended up taking a few classes, which really solidified my skills.
Molly: Why did you decide to enter Iron Viz?
Christian: I really enjoy getting out of my comfort zone and challenging myself, and if you spend any amount of time around the Tableau Community, you soon learn that Iron Viz is one of the best ways to challenge yourself and improve upon your data visualization skills.
Molly: How much time did you spend preparing for the competition?
Christian: I believe that we had 14 days from receiving the Iron Viz data set to filming the Iron Viz build. I was in Sedona, Arizona, camping with family and off-the-grid on vacation for four of those days. So, all in all, it was about 10 days that were jam-packed with data exploration, data cleaning, visualization design, and practice, practice, practice.
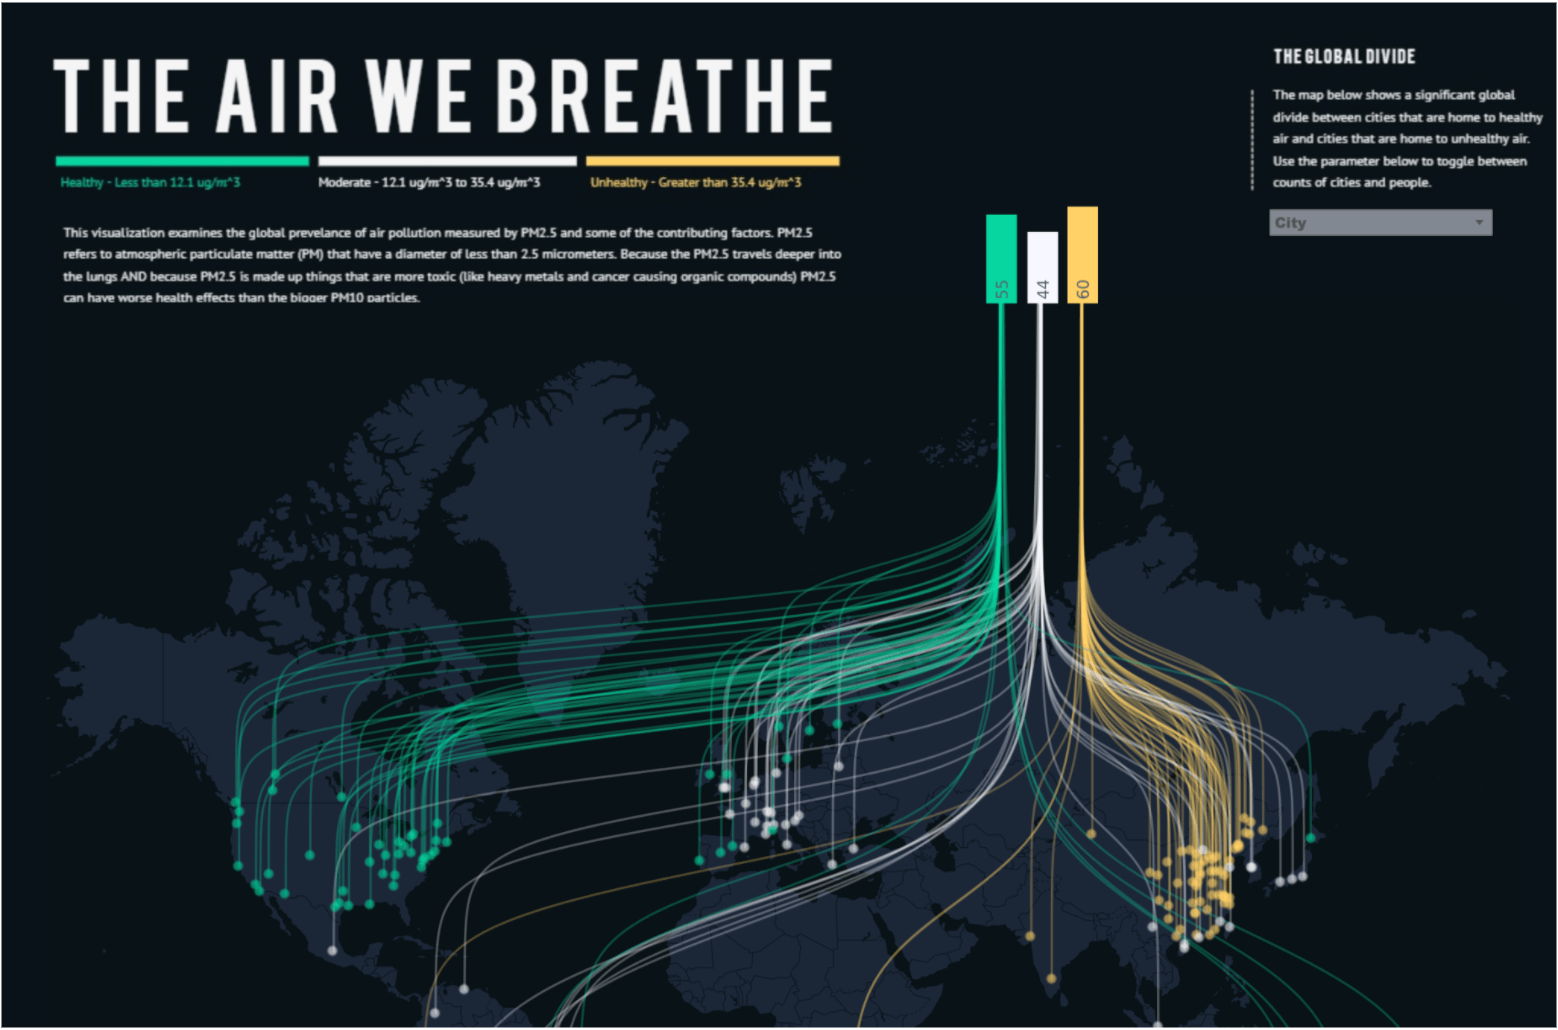
Christian Felix’s winning visualization from Iron Viz 2020. [Christian Felix/Tableau Public]
Molly: You also mentored one of the students at your alma mater, University of Arizona, who was a finalist for Iron Viz: Student Edition. How did that come about?
Christian: That was such a cool experience because it showcased how much could be picked up and learned with Tableau in such a short period of time. This was a student, Parth Agarwal, who started using Tableau through some of his class assignments and had very quickly been able to conduct some pretty advanced analysis with Tableau.
Over the course of a few weeks, we did a couple of Zoom meetings where I was able to share some visualization best practices and talk through different methods to accomplish interactivity within the flow of visual analysis. I was amazed at the end product he produced and submitted for the Iron Viz: Student Edition contest, and of course, ecstatic that he was named one of the winners.
Molly: Speaking of applying your data skills, you recently joined Tableau as a Lead Solutions Engineer, Life Sciences. Can you let us know why you chose to come on board?
Christian: I started in mid-September 2021, and I couldn’t be more excited to be part of the team. Tableau has been transformative for me. Not just because of the things it has allowed me to do with data, but in the relationships it has helped me develop and the career opportunities it has opened up.
Tableau is transformative because it facilitates those “aha” moments of discovery and insight like no other tool, and those are the moments that give me the most energy and satisfaction from a work perspective. As a Solutions Engineer with Tableau, I expect to enjoy plenty of those moments as I engage with data and analytics leaders within the Life Sciences industry and show them the “art of the possible” with Tableau.
Molly: What has your internal Tableau experience been like so far?
Christian: It’s been fantastic. The onboarding content and training have been engaging and so well done. At Roche (which is where I came from), our team was able to do some incredibly innovative things with data, and Tableau was the centerpiece of those efforts.
We were also just beginning to leverage the synergies between Salesforce and Tableau with things like embedded analytics and AI. I think there is a ton of value to be gained by adoption and expertise in that space, particularly within life sciences, where each new insight and data discovery can mean a higher quality test, a more reliable device, or a more efficacious treatment for a patient.
Molly: As you prepare to be one of the judges for this year’s Iron Viz contest, what are you looking for in an Iron Viz Champion?
Christian: I expect each of the visualizations to be mind-blowing as Iron Viz always seems to bring out new and innovative techniques for displaying data. What will really set the eventual champion apart will be the ability to be novel and innovative, but also to do so in a way that is simple and clear to understand.
In the words of statistics guru Hans Rosling, I think the winner will have to “show the data in a way that is both enjoyable and understandable.” I’d look for the champion to be the one who is most able to optimally weave together the technical, artistic, and emotional storytelling components of the competition.
Molly: Any last words of encouragement for our finalists?
Christian: I think the closing paragraph in the blog post I wrote a year ago still applies. The spirit of Iron Viz is one of “friendly competition,” therefore try not to take yourself or any of the spectacle that is Iron Viz too seriously. Do your best. Treat the opportunity with respect, but by all means, have fun and enjoy the ride!
관련 스토리
How one university is instilling data skills in the next generation of business leaders
Subscribe to our blog
받은 편지함에서 최신 Tableau 업데이트를 받으십시오.