Best of the Tableau web: Data culture and business transformation
Hello, Tableau community! Welcome to Andy's February round up of the best content being produced by you, the Tableau community.


Hello, Tableau community! Welcome to my monthly round up of the best content being produced by you, the Tableau community.
Recently, I’ve noticed the emergence of people blogging about data culture and business transformation. Annabelle Rincon has been a long-time Tableau user, and recently started a new role heading up a Centre of Excellence at Vontabel. Her post about the beginning of this role is enlightening. The big question she asks herself is: should I be running a Centre of Enablement? I love this concept. “Excellence” implies that the people on the team are the talent-holders. “Enablement” implies that the skills are being passed outwards, throughout an entire company. She’s planning her role using Tableau Blueprint as a path to success.
Benjamin Du, from Interworks, also wrote a post around Blueprint. In his post, he identifies 5 red flags that should tell your Tableau implementation isn’t ideal. Custom SQL? Red flag. Reliant on Web Data Connectors? Another red flag. Data held on Sharepoint? One more red flag for you. Cubes? Have a flag, it’s red. JSON? There’s your 5th. Sure, there may be valid reasons for each of those, but if you are trying to implement analytics at scale, each one of these should be seen as indicator of trouble to come.

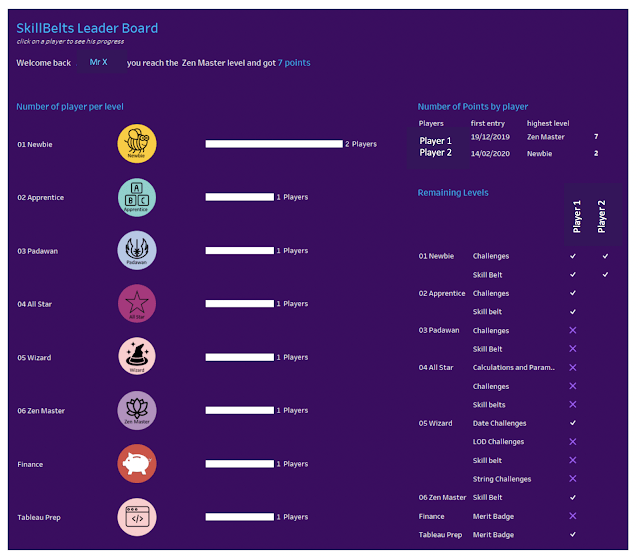
Finally, in the last month, we announced our new Tableau Zen Masters. Nearly 50% of this year’s Zen Masters are new—and for many—the content I’ve featured in these round ups helped get them into the program. After the Zens were announced, Mark Bradbourne (formerly an active community member, now at Tableau) wrote a great post about what it means to be a Zen Master. It perfectly articulates the kind of content I love the most: altruistic content made from the heart. The title of the post says it all: “If the title of Zen Master didn’t exist, would you still do all the things you do today?” Write about what you love, and your passion will make people sit up and take notice.
As always, enjoy the list! Follow me on Twitter and LinkedIn as I try and share many of these throughout the month. Also, you can check out which blogs I am following here. If you don’t see yours on the list, you can add it here.
Tips and tricks
Angelos Pachis Why you need and how to create a shaded slope chart
Luke Stanke Introducing Tableau 360
Spencer Baucke 4 Tips for Organizing Your Tableau Workbooks
Toan Hoang Tableau QT: Completion Gantt Charts
Shaun Davis Six Things That Are Killing Your Dashboard Performance
Bona Wang Tableau 2020.1: Dynamic Parameters
Ryan Sleeper Innovative Tableau: How to Add Vertical Lines to Connect Slope Graphs
Andy Kriebel #TableauTipTuesday - How to float an entire dashboard and a filter
Jim Dehner Dates Functions and Other Necessary Evils
Brian Moore Nested Bubble Chart with Dynamic Anchor
Mark Edwards Getting Animated Part 2 – Basic Bar Charts In Tableau
Chris Meardon Characters we all need in our lives →■△◢◯◱¼α
Eric Parker Connect the Actual Line to the Forecast Line in Tableau
David Pires Using GitHub Pages to host your visualizations
Marc Reid Buffer Spatial Calculations
Filippos Lymperopoulos Competitive Analysis with Buffer Calculations
Kendra Allenspach How to Improve Your Tableau Work with Documentation
Merlijn Buit How to design a beautiful Tableau Navigation or Export button with Figma
Jess Hancock Bar Charts: Colour-Coding the Top X using the Index function
Inspiration
Louise Shorten Viz Animations in Tableau
Bridget Cogley STROOPIFIED! Tableau Dashboards, Color, and Functional Aesthetics – TableauFit
Jeff Plattner Tableau Public Revizited | Feb 18, 2020
Adam Green D is for Dinosaur
Mark Bradbourne If the title of Zen Master didn’t exist, would you still do all the things you do today?
Sarah Bartlett Iron Quest – Healthcare in Prisons – Recap
Kevin Flerlage Bridges to Prosperity, Design Process & a Cool Little Trick (Guest Post)
Josh Tapley Top Favorites Week of Feb. 2nd
Ivett Kovács Polygons are everywhere!
Adam Green E for Explorer
Chris Love Data Governance – Your Biggest Challenges?
Aidan Bramel In My Opinion: 2020.1 Release
Ken Flerlage Creating a Scrollable Timeline in Tableau
Lindsay Betzendahl Mindful Vizzing: Walking in Someone Else’s Shoes
Robert Curtis This Old Viz: Trees of London Edition
Steve Wexler Chart Chat Live — Round 10
Tableau Prep
Ken Flerlage Tackle Data Dictionaries with Tableau Prep
Carl Allchin How to...Shape Data
Danny Steinmetz Setting up Tableau Prep with R Integration, Part 2
Calculations
Ken Flerlage 20 Uses for Level-of-Detail Calculations
Alexander Mou 20 Calculation Use Cases: LOD vs Non-LOD
Eric Parker Accounting for Leap Years in Tableau YTD Calculations
Jeffrey Shaffer A Journey to Custom Subtotals with Table Calculations
Andy Kriebel #TableauTipTuesday - How to Use Level of Detail Expressions to Create a Daily Profit KPI
Klaus Schulte Adding Custom Sub-Totals in Tableau
Luke Stanke How to calculate percent of total in Tableau: Four ways
Formatting, Design, and Storytelling
Mark Edwards Getting Animated With Tableau’s New Feature – Part 1: Line Charts
Luke Stanke Tableau Animations: Scrolling Bar Chart
Rosario Gauna Drill Down With Left Menu & Drill Up With Top Menu
Lindsay Betzendahl Two of My Favorite Things: Containers and LODs (I may be crazy)
Set and Parameter Actions
Code
Server
Mark Wu Advanced Deployment (9/10): Increase Tableau server extract backgrounder efficiency
Ben Moss User Filtering with a Security Table in Tableau Server
Bryant Howell Generating Good Thumbnails / Previews using Tableau Server REST API
Spencer Baucke Handling Excel Files in Tableau Server
Eric Parker How to Set Permissions for Tableau Dashboards
Data Culture and Blueprint
관련 스토리
Meet Iron Viz 2024 Finalist Chris Westlake
 2024/04/22
DataFam Roundup: April 15–19, 2024
 2024/04/19

Meet Iron Viz 2024 Finalist Jessica Moon
2024/04/15
Subscribe to our blog
받은 편지함에서 최신 Tableau 업데이트를 받으십시오.