Viz your Tableau Conference schedule in 3 steps


Tableau Conference is a multi-day extravaganza of data and data people. There’s something for everyone, but identifying what opportunities are right for you can be a bit daunting. If you want to maximize your experience at TC17 in Las Vegas—if you prefer your decisions to be truly data-driven—read on!
This year’s schedule is available on the TC website and Data17 app (get yours on Google Play or the App Store). But for the purposes of vizzing your Tableau Conference schedule, we recommend the Web Data Connector, where you can easily pull TC schedule data into Tableau for your visualization pleasure.
Get started
Step 1: Connect to data.
In Tableau Desktop, choose Web Data Connector from the Connect pane (it’s in the “To a Server” option under “More”).
Step 2: Configure.
Enter this URL: http://tc17.tableau.com/wdc/schedule. There, you can choose to connect to data about sessions or speakers (or both).
Pro tip: To explore both data sources, create two data connections—one to Sessions and one to Speakers, and blend on Session ID.
Step 3: Explore.
Once your data is in Tableau, let your imagination run free. Are you interested in creating a dashboard to help others navigate the schedule, or are you just mapping out your own?
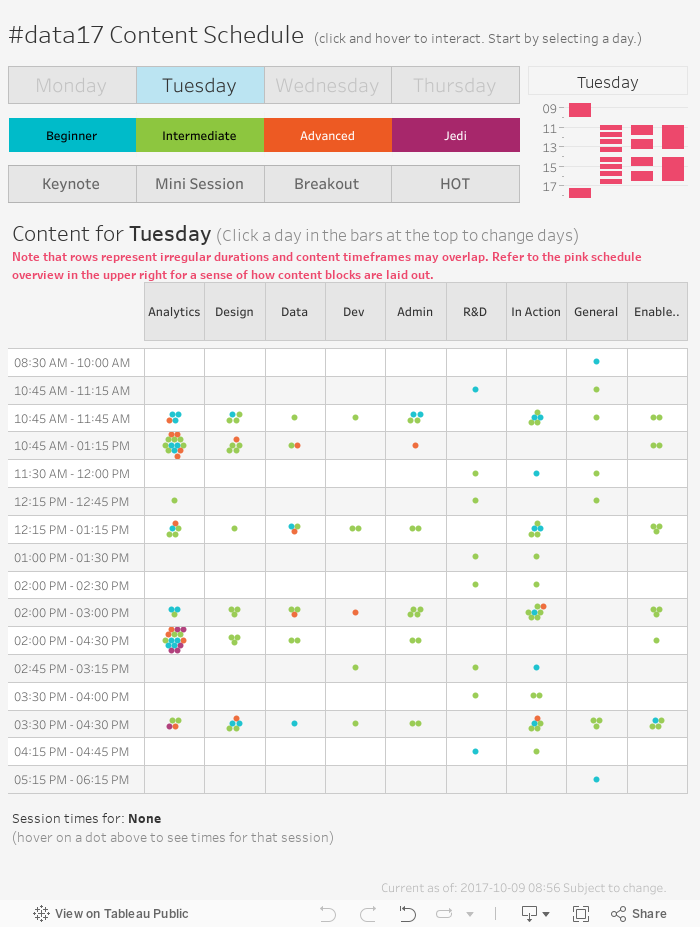
I decided to make an interactive schedule, below. The hardest part for me was figuring out how to deal with the three different types of content: Breakouts, Mini Sessions, and Hands-On Training. My solution was to have a schedule overview using a Gantt chart to visually represent the different time slots. What can you come up with?
Data source details
When you connect to the schedule data, you’ll see many fields. Here’s what they mean:
Sessions
- Abstract: the abstract for the session. Line breaks are preserved, but other formatting might not be.
- allTags: the tags associated with the session. See Notes section below for information on working with the allTags field.
- Content Type: designates Breakout, Hands-On Training, Keynote, Mini Session, or Training Workshop types.
- Disclaimer: states “Current as of:
Subject to change.” - End Time: when the session ends. See Notes section below on working with Start and End times.
- Level: designates content as Advanced, Beginner, Intermediate, or Jedi level.
- Room: (currently TBA)
- Session ID: unique ID assigned to each instance of a session. That is, if a session is repeated, there will be a session ID per timeslot. Note: To get total number of sessions, use count distinct on this field. Join on this field if using both Sessions and Speakers.
- Start Time: when the session starts. See Notes section below on working with Start and End times.
- Title: the title of the session.
- Track: designates content as Analytics, Dashboards & Design, Data, Developer, Enablement & Adoption, General, IT & Server Administration, Research & Innovation, or Tableau in Action tracks.
Speakers
- Bio: the speaker's bio.
- Disclaimer: states “Current as of:
Subject to change.” - First Name: the first name of the speaker. See Notes section below for information on getting a full name.
- Job Title: the speaker’s job title.
- Last Name: the last name of the speaker. See Notes section below for information on getting a full name.
- Organization: the speaker’s organization.
- Session ID: the unique ID assigned to each instance of a session. That is, if a session is repeated, there will be a session ID per timeslot. Note: To get total number of sessions, use count distinct on this field. Join on this field if using both Sessions and Speakers.
- Speaker ID: unique ID assigned to each speaker.
Notes on working with specific fields
allTags
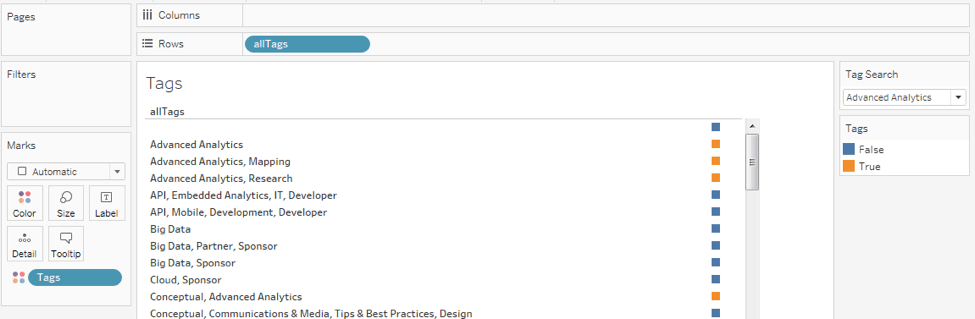
The allTags text field displays all tags associated with a session.
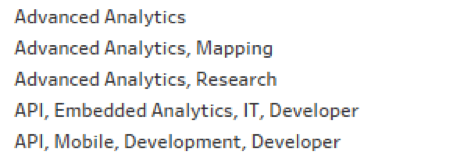
Because tags are strung together with commas, as shown in the screenshot above, you may run into trouble using filters. For example, if you were to filter for “Advanced Analytics,” you’d filter out “Advanced Analytics, Mapping” and “Advanced Analytics, Research,” as those are recognized as different values.
Never fear! Just set up a parameter and calculation to avoid this issue:
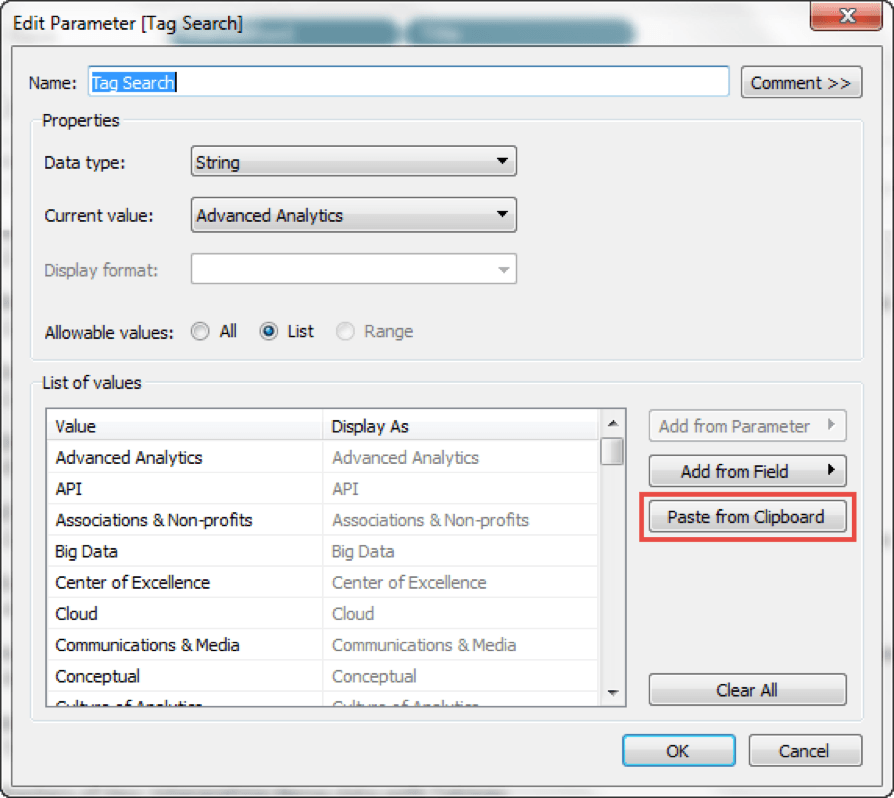
- Create a string parameter called Tag Search that’s simply a list of all possible tags.
- Create a calculation that evaluates if the tag that is selected in the parameter is present in the allTags field.
- Use that calculated field to color, filter, or otherwise manipulate your viz.
It’s easy to create a parameter for a list of values by simply pasting the values. Select the entire list of tags, as in the screenshot below, and use the “Paste from Clipboard” option.
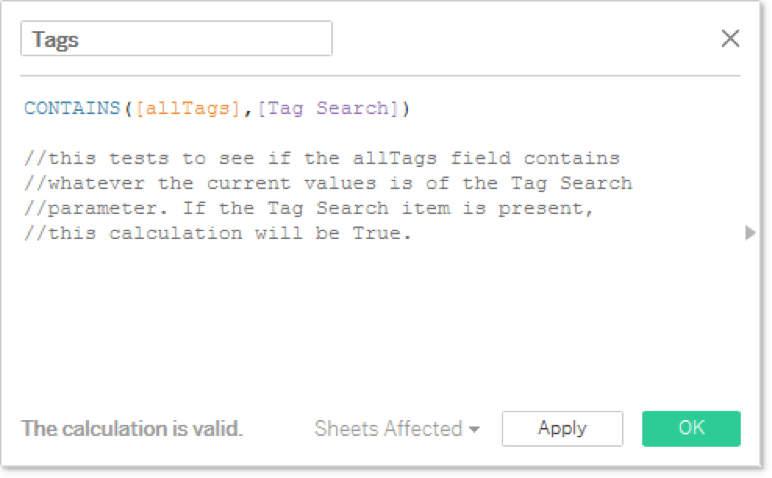
Then, create a calculated field that simply evaluates True or False if the allTags field contains the tag from the Tag Search parameter.
Now it’s easy to use that Tags field to search the sessions by a single tag.
Click here for a complete list of all possible tags.
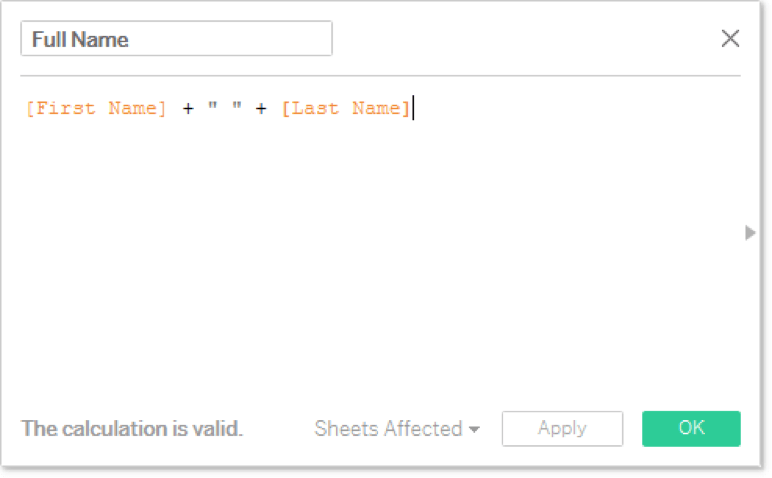
Full Name
To get the full name of the speaker, you’ll need to concatenate the First Name and Last Name fields. Don’t forget the space between them!
Start Time and End Time
By default, the Start Time and End time fields will come into your Tableau view as discrete dates—meaning, when you drag them onto the canvas, they’ll start with Year and be drillable down to Quarter, Month, etc.
If you set these fields to Exact Date, they’ll adhere to this format: 10/10/2017 11:45:00 AM. (Depending on where the field is used, it might also need to be set to Discrete.) But you can easily change the display properties of these fields so they show up how you want:
First, access the format menu. To set the default format of the date field:
- Right-click on the field in the data pane and select Default Properties > Date format.
To set the format for the date field in a specific viz:
- Bring the field into the view. Right-click on the pill and choose Format.
- The format pane will open over the data pane.
- Find the dates option under the Default section and expand the menu.
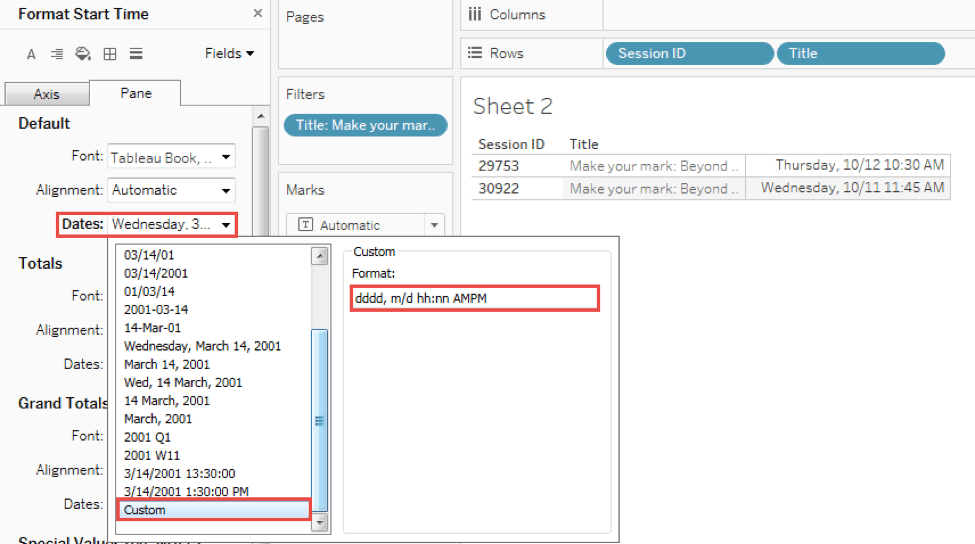
Then, choose Custom from the list and enter in the custom format you want for your date values.
For example, dddd, m/d hh:nn AMPM would appear as “Thursday, 10/12 10:30 AM.”
The Custom format options are extensive, but some common ones are:
- dddd = full day of the week, such as Thursday
- ddd = abbreviated day of the week, such as Thu
- dd and d = numerical day, such as 12
- mmmm = full month, such as October
- mmm = abbreviated month, such as Oct
- mm and m = numerical month, such as 10
- hh = the numerical hour, such as 9
- nn = the numerical minute, such as 30
- AMPM = this will show AM or PM depending on which is applicable
- Only some punctuation is supporting in the format:
- Supported: . , ( ) / : - | { }
- Not supported: @ [
- Some letters already have meaning and can’t be used, but “at” can be typed out
- As an example, here’s some data formats and their results:
- ddd - hh:nn AMPM Tue - 11:45AM
- dddd | hh:nn (AMPM) Wednesday | 12:45 (PM)
- mm/dd at hh:nn AMPM 10/12 at 10:30 AM
We recommend having a date in the view as you’re setting the custom format. It’s responsive, so you can test your formatting in real time.
Colors
Want to brand your dashboard with TC17 colors? Copy and paste the color palettes from this document.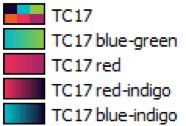
It’s easy! Simply add any or all of the custom color palettes to your preferences file. Detailed directions on how to Create Custom Color Palettes can be found in the Tableau Help.
Share your TC schedule viz
What will you find in the TC schedule data? Share your viz with #data17!
Learn more about Tableau Conference and building the perfect dashboard with these resources:
관련 스토리

Visualizing Women's Impact to History Through Data Visualization
 2024/03/18

Behind the Viz: Adrian Zinovei Helps You Design Your Next Dashboard
2024/03/01

Charting the Heart: Data Visualizations on Love
 2024/02/14
Subscribe to our blog
받은 편지함에서 최신 Tableau 업데이트를 받으십시오.