Leverage Tableau's getData() API feature to add commenting to your viz


Note: The following is a guest post by Tableau Zen Master Tamas Foldi.
Managing a group of Tableau consultants who want to satisfy demanding customers is an exciting job. As Tableau helps people understand their data, we help them do it in the most efficient and elegant way.
Sometimes this involves heavy customization. We might add beautiful tailor-made chart types. Or we might get the dashboard's underlying and summary data in multi-sheet Excel workbooks. Sometimes we even provide a real-time interactive experience by manipulating the data and integrating with external business applications—all directly from the visualisation itself.
We leverage Tableau 10's feature-rich APIs to handle that last request. They provide a simple way to combine custom workflows with Tableau's unparalleled visualization capabilities. The most sought-after requirement is to extend collaboration capabilities with cross-device data annotation and database write-back features.
Tableau 10's enhanced JavaScript API’s getData() functionality lets us get at the heart of these matters with just a few lines of code. As we recently demonstrated for two of our clients, adding a comment or a question on a data point in a Tableau Server visualization is no longer just wishful thinking. By providing programmatic access to the underlying data in a visualization, these previously unaddressed requirements are becoming a reality.
This way, decision makers and analysts can stay right with the data and start asking deep-dive questions in context. Even enterprise workflow tools can be extended in an agile way by directly feeding them the data from visualizations. Interactivity has generally been the hallmark of Tableau’s visualizations, and getData() takes this interactivity to a whole new level.
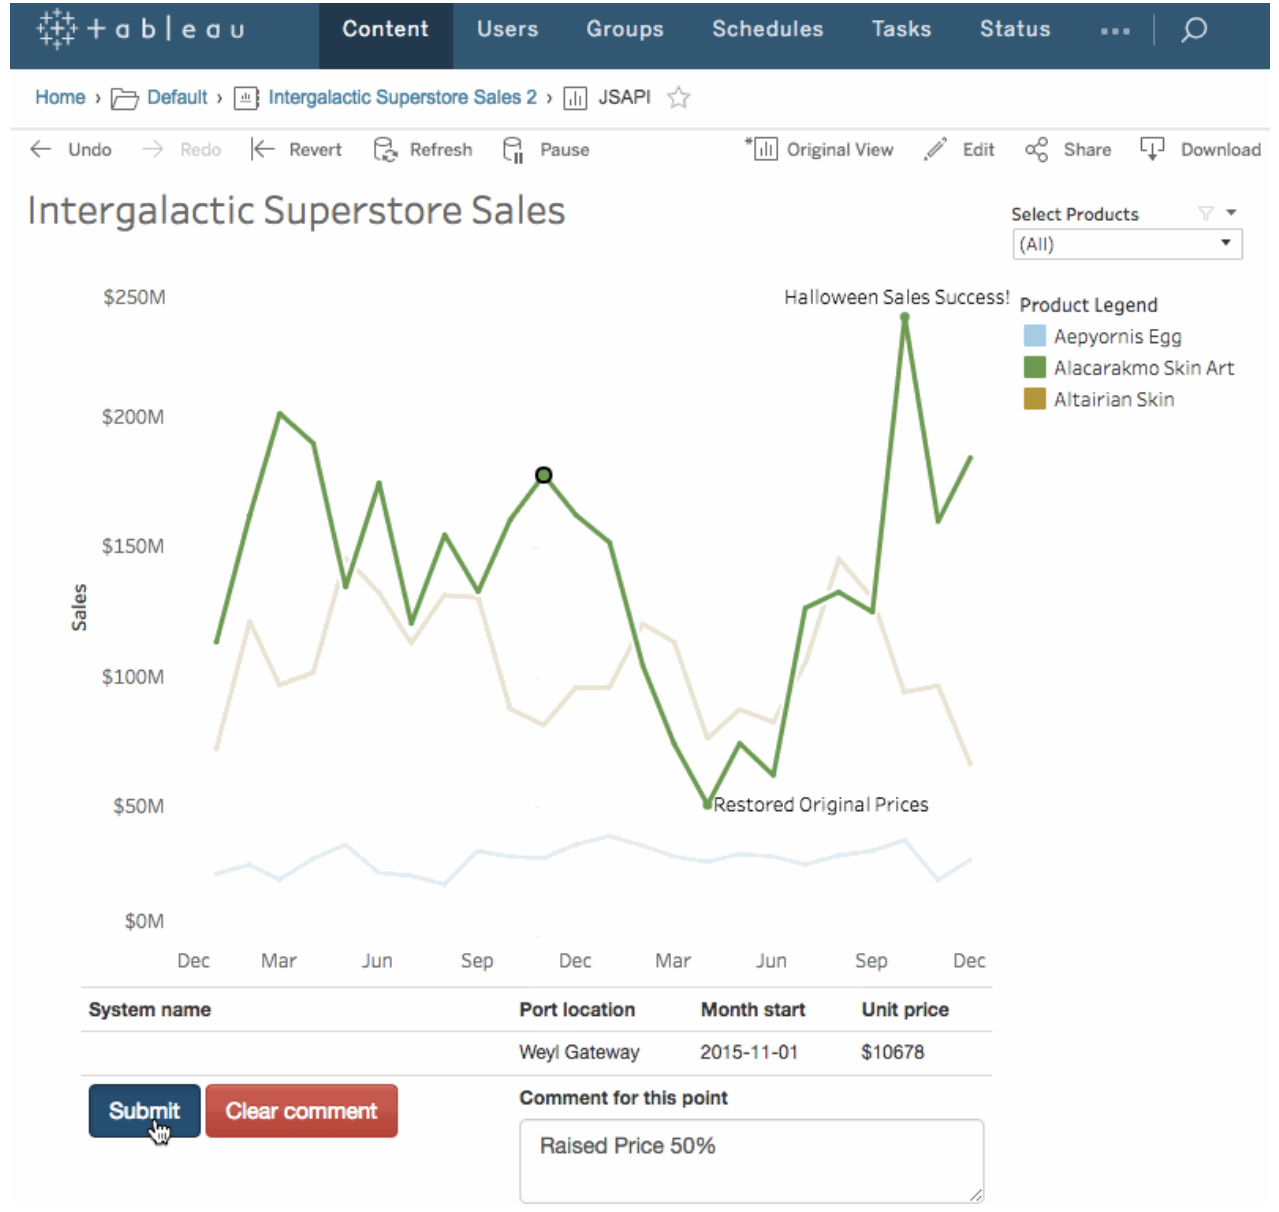
A simple use case is to modify the underlying data in a visualization—for example, a comment field filled out by the analyst. To make it more dramatic, we’ll modify the data points in the actual visualization:
By selecting the data point on the visualization, you can add a comment. All details in this prompt are provided by the getData() API call already.
If we hook up this prompt to a web service that can write in the database that supplies the underlying data, we get same functionality you see above. You enter a comment, hit “submit,” and you instantly see the modified values on the auto-refreshed view. All these components are held together by getData() as this piece of JavaScript code has access to the data set.
Behind the scenes
The project uses a couple of black-belt techniques to achieve a seamless integration between the Tableau Server VizPortal and our interactive dashboard.
First of all, the input form is an embedded HTML frame inside the dashboard. This ensures that input controls are an organic part of the visualization. Also, by using the Tableau JavaScript API without embedding, there is no need to embed the dashboard into a third-party portal; all Tableau JavaScript API functions work perfectly in VizPortal.
But this is just one example. Since the API covers all interactions from data filters to mark selection events, the possibilities are endless.
All technical instructions on how to build and deploy this sample project are available on GitHub.
How are you using Tableau’s new getData() feature? Let us know in the comments below.
For more tips, tricks, and vizzes by Tamas, check out his Tableau Public profile page and his blog. You can also connect with him @tfoldi.
Do more with Tableau's APIs
관련 스토리

How to Embed a Data Viz from Tableau Cloud into Your Google Docs
 2023/08/16

Intro to the Salesforce Developer Universe
 2023/05/05

Calling all Tableau Developers for TrailblazerDX 2023
 2023/02/01
Subscribe to our blog
받은 편지함에서 최신 Tableau 업데이트를 받으십시오.