DataFam Roundup: January 10 - 14, 2022


Welcome! Dig into the first DataFam Roundup (of 2022!!)—a weekly blog that brings together community content all in one post. As always, we invite you to send us your content—and the DataFam content from your peers that have inspired you! Find the content submission form here.
DataFam content
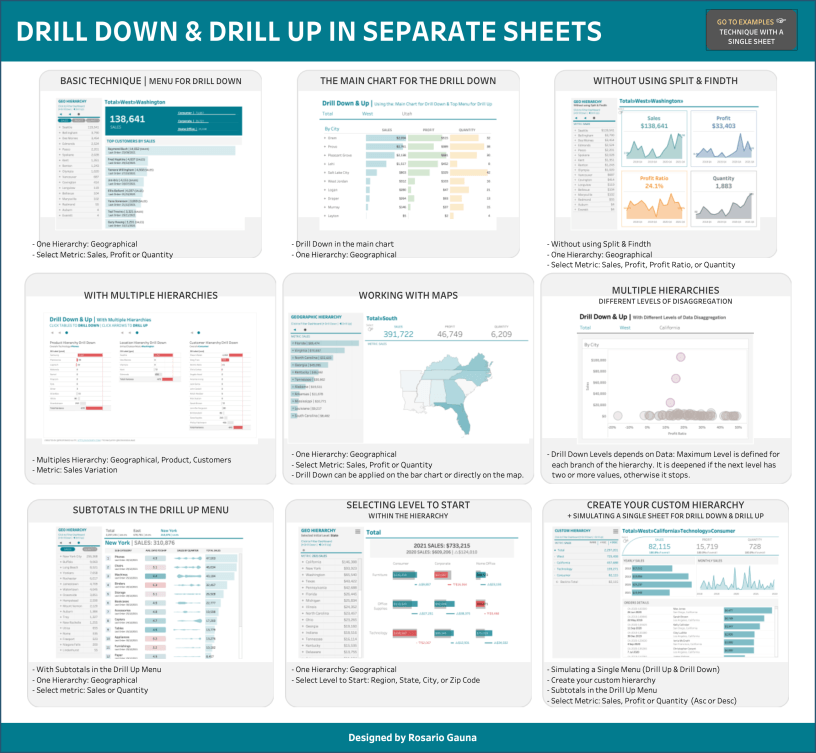
Rosario Gauna: Technique: Drill Down & Drill Up in Separate Sheets
Dive into content created by the Tableau Community:
- Adam Mico: Tableau’s Next | 2022
- Kevin Flerlage, The Flerlage Twins: Introducing the Transparent Color Hex Code in Tableau
- Will Sutton: Level 1: Player Select Roundup
- Rosario Gauna: Technique: Drill Down & Drill Up in Separate Sheets
- Darragh Murray: The importance of exploratory data analysis: Exploring the first B2VB challenge
- Yamil Medina and Aaron Simmons: 3Charts@3PM: A Mystery Chart Show | Healthcare Episode
- Ajay Manshani: Need of Data Management
- Sarah Bartlett, Sarah Loves Data: Reasons to Enter Iron Viz 2022
- Klaus Schulte, CO data: Using Tableau Public Templates Efficiently
- Jonathan Schwabish, PolicyViz: The Flerlage Twins
- Jonathan Drummey and Keith Helfrich, Action Analytics: Bid and Proposal Analysis
- Annabelle Rincon, Rativiz: End of year review
- Steve Adams: The five keys to Analytics in the flow
From Team Tableau
- Sarah Battersby: Exploring geocoding in Tableau
- Iron Viz 2022 Global Qualifier: Visualizing the Arts
- Apply to join the next class of our Community Equity Task Force
- Best of the Tableau Web: December 2021
Upcoming events and community participation

Tableau Community Blog: Tableau Community leaders share their top 2021 highlights
- Braindates, Data Leadership Collaborative: Take advantage of the collective knowledge of like-minded peers from around the world. Connect one-on-one or in groups with fellow data leaders. Add your topic of interest or join other conversations to teach, learn, and inspire.
- Chartchat, 2021 Year in Review: Watch as Jeffrey Shaffer, Steve Wexler, Andy Cotgreave, and Amanda Makulec debate the good, the bad, and the "scaredy-cats" of data visualization.
- Iron Viz 2022 Qualifier Event: Need a boost getting started or strategies for taking your submission to the next level? Sarah Bartlett, Iron Viz finalist and Iron Quest founder, and Lisa Trescott, 2021 Iron Viz Champion will be share their experiences and tips LIVE. Plus, we’re saving time for a Q&A. We hope to see you there! And remember, win or learn—you can’t lose.
- Get your Tableau CRM questions answered on the Forums.
- Stay up to date with the latest and greatest from the Tableau Community. We'll help you along in your Tableau journey, bring your data skills to the next level, and nurture powerful connections.
- DataViz Social Initiatives: "A couple of social initiatives stopped in 2021. I see comments about missing them and was curious what people were looking for. While I have thoughts, I want the data. My goal with this survey is to get a pulse and put the data out there. You will not identified unless you choose to be identified. This is not a commitment on my part nor yours to create an initiative."
- The Feedback Loop Sign-Up Form: January 2022 This data vizzing workshop was started by Joshua Smith and is based on creative art workshops. He put it best: "The idea of the Feedback Loop, and of creative arts workshops in general, is meant to test the subjective and aesthetic elements against peers. It's meant to provide diversity of perspectives, because what works for one person may not work for another. And, what I've learned now, it can create an incredible community of people devoted to helping one another grow as artists."
- Sign up to be a panelist for the 3charts@3 Live: A Mystery Chart Show featuring topics like personal finance, energy, healthcare and more!
Vizzes
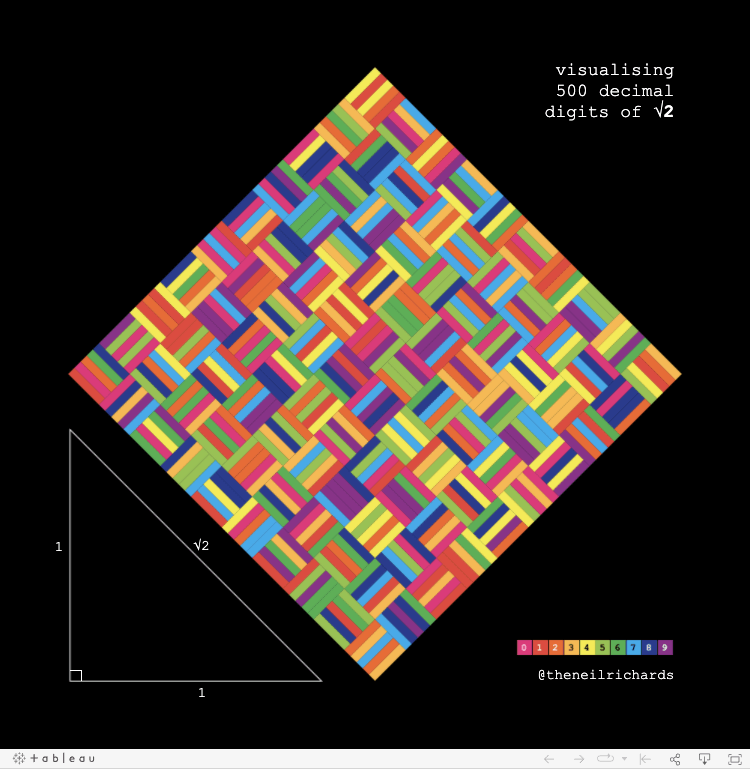
Neil Richards: Visualising 500 decimal digits of √2
Catch this week’s Viz of the Days here and subscribe to get them emailed directly to your inbox.
Check out some inspirational vizzes created by the community:
- Rosario Gauna: Drill Down-Up 15 Examples
- Neil Richards: Visualising 500 decimal digits of √2
- Rafael Centeno Pérez: 2021 F1 Season
- Peter Fakan: Isometric Australia Prototype
Community Projects
Back 2 Viz Basics *NEW!
A bi-weekly project helping those who are newer in the community and just starting out with Tableau. Not limited just to newbies!
Web: Back 2 Viz Basics
Twitter: #B2VB
Week 1: Build a Scatter Plot
Data Plus Music *NEW!
A monthly project visualizeing the data behind the music we love!
Web: Data Plus Music
Twitter: #DataPlusMusic
January 2022: The Grammys
Games Night Viz *NEW!
A monthly project focusing on using data from your favorite games.
Web: Games Nights Viz
Twitter: #GamesNightViz
January 2022: Level 1: Hello World
Workout Wednesday
Build your skills with a weekly challenge to re-create an interactive data visualization.
Web: Workout Wednesday
Twitter: #WOW2021
Week 02: Can you build a weekly Year-over-Year line chart?
Preppin' Data
A weekly challenge to help you learn to prepare data and use Tableau Prep.
Web: Preppin’ Data
Twitter: #PreppinData
Week 52: Departmental Decemeber - Operations
Iron Quest
Practice data sourcing, preparation, and visualization skills in a themed monthly challenge.
Web: Iron Quest
Twitter: #IronQuest
Storytelling with Data
Practice data visualization and storytelling skills by participating in monthly challenges and exercises.
Web: Storytelling with Data
Twitter: #SWDChallenge
January 2022: visualizing cycles
Project Health Viz
Uncover new stories by visualizing healthcare data sets provided each month.
Web: Project Health Viz
Twitter: #ProjectHealthViz
January 2022: One Year of Sleep
Diversity in Data
An initiative centered around diversity, equity & awareness by visualizing provided datasets each month.
Web: Diversity in Data
Twitter: #DiversityinData
November - December 2021: The countdown to Christmas and New Year!
SDG Viz Project
Visualize data about Sustainable Development Goals provided by the World Health Organization.
Web: SDG Viz Project
Twitter: #TheSDGVizProject
Sports Viz Sunday
Create and share data visualizations using rich, sports-themed data sets in a monthly challenge.
Web: Sports Viz Sunday
Twitter: #SportsVizSunday
January 2021: BBC Sports Personality of the Year
Viz for Social Good
Volunteer to design data visualizations that help nonprofits harness the power of data for social change.
Web: Viz for Social Good
Twitter: #VizforSocialGood
Nov 28, 2021 - Jan 7, 2022: visualize our community
Real World Fake Data
Create business dashboards using provided data sets for various industries and departments.
Web: Real World Fake Data
Twitter: #RWFD
Viz 2 Educate
Each month, create vizzes on global education syllabus topics as resources for teachers worldwide.
Web: Viz 2 Educate
Twitter: #Viz2educate
Makeover Monday
Join the community every Monday to work with a given data set and create better, more effective visualizations.
Web: Makeover Monday
Twitter: #MakeoverMonday
関連ストーリー

DataFam Roundup: April 8–12, 2024
 2024/04/12
DataFam Roundup: April 1–5, 2024
2024/04/05
DataFam Roundup: March 25–29, 2024
2024/03/29
Subscribe to our blog
Tableau の最新情報をメールでお知らせします