DataFam Roundup: April 12 - April 16, 2021


Welcome back! Dig into the latest DataFam Roundup—a weekly blog post that brings together what’s trending in the community all in one post. As always, we invite you to send us your content—and the DataFam content from your peers that have inspired you! Find the content submission form here.
DataFam blog content
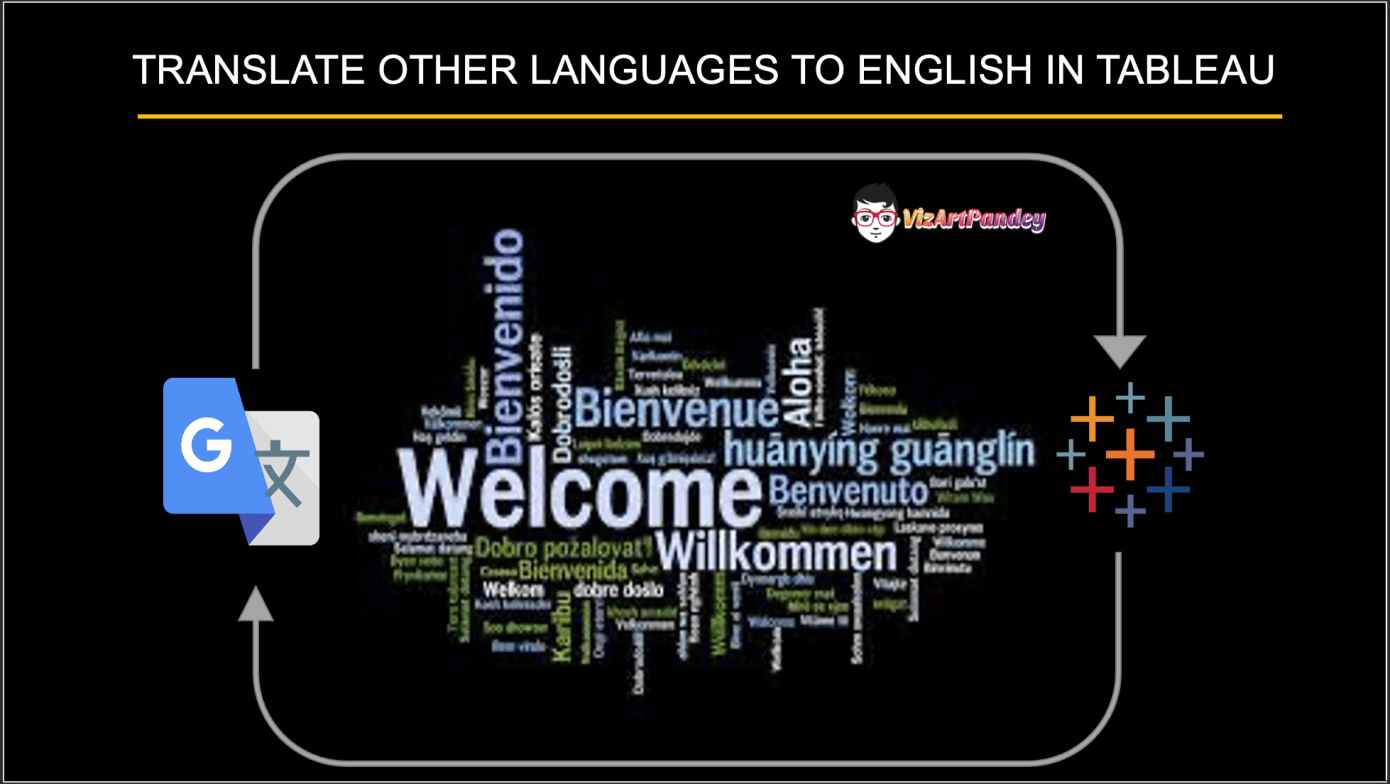
Translate other languages to English in Tableau, Avinash Reddy Munnangi
Dive into content created by the Tableau Community:
- Preparing for the Tableau Desktop Certified Associate Exam Ella Worsdale
- Come si gioca con la matematica? Un ripasso per passare dai grafici alle funzioni Fabio Fantoni (Italian)
- An Interview with Zak Geis Adam Mico
- Date Calculation Cheat Sheet Ken Flerlage
- Customizing Filters using Containers | Formatting Filters Vani Agarwal, Ivy Pro School
- Translate other languages to English in Tableau Avinash Reddy Munnangi
- Input from Tableau Server into Alteryx Workflow Christopher Marland
- Tableau Visual Guidebook Roshaan Khan
- Ten Tiny Tableau Tips Autumn Battani
- Level up your data viz Pascal Barry
- Tableau Jobs Alan Murray
- How to Create Bump Chart In Tableau| Tableau Tutorial for beginners Gurpreet Singh
- A change to your regular podcast Emily Kund and Matt Francis
- You Don't Need Permission Brandi Beals
- This Week in #VOTD | 2021 Sean Miller
Upcoming events
DataDev Day
Join an upcoming Tableau User Group event:
- April 21, 2021: Tableau's Racial Equity Data Hub: Process, scope & impact
- April 21, 2021: Wisconsin Virtual TUG
- April 22, 2021: Data + Women Ireland
- April 22, 2021: Japan Tableau Prep User Meeting
- April 26, 2021: Analytics TUG
- April 28, 2021: Ahmedabad Fireside Chat with Francois
Check out all the virtual Tableau User Group events here.
April 20, 2021 Quantified Self: Hand Drawn Data Visualisations: See some more real world examples on Hand Drawn Data Visualisations, with data that has been manually collected. This webinar features Sophie Sparkes and Andy Kriebel from The Information Lab, but we also have a special guest from Tableau, Taha Ebrahimi.
April 22, 2021 Zero to Zen – and five stops along the way: Zen Master Jim Dehner shares the five basic concepts he needed to understand on the road from spreadsheet to Tableau. Like many I started at ground zero with a background using spreadsheet calculators but no real experience with visual analytics or Tableau. It took some work and there were some rough spots on the journey but along the way there were 5 basic concept that I really need to understand.
May 20, 2021 Tableau’s first DataDev Day: We’re excited to announce a new, one-day event dedicated to DataDevs and anyone interested in or using the Tableau developer platform to create integrations and customize Tableau for their organizations.
Vizzes

Lacrosse D1 Champions, Simon Rowe
Catch this week’s Viz of the Days here and subscribe to get them emailed directly to your inbox.
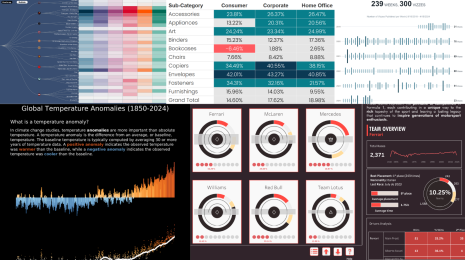
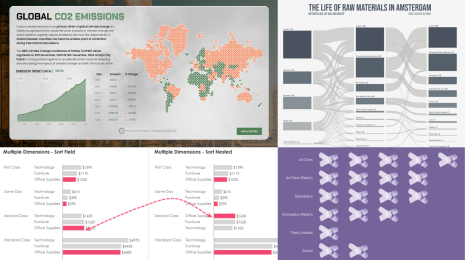
Check out some inspirational vizzes created by the community:
- Creating Lacrosse D1 Championships using Map Layers Simon Rowe
- Most famous composers of the 20th century Judit Bekker
- My Netflix Activity | Radial Version Priyanka Dobhal
Community Projects

Stay in the loop on the Tableau Community Projects:
Makeover Monday
Join the community every Monday to work with a given data set and create better, more effective visualizations.
Web: Makeover Monday
Twitter: #MakeoverMonday
Week 15: Fouls Called Game by NBA Refereees
Workout Wednesday
Build your skills with a weekly challenge to re-create an interactive data visualization.
Web: Workout Wednesday
Twitter: #WOW2021
Week 15: Website Analytics
Sports Viz Sunday
Create and share data visualizations using rich, sports-themed data sets in a monthly challenge.
Web: Sports Viz Sunday
Twitter: #SportsVizSunday
April 2021: NCAA D1 Lacross
Iron Quest
Practice data sourcing, preparation, and visualization skills in a themed monthly challenge.
Web: Iron Quest
Twitter: #IronQuest
March 2021: Diversity in Entertainment
Storytelling with Data
Practice data visualization and storytelling skills by participating in monthly challenges and exercises.
Web: Storytelling with Data
Twitter: #SWDChallenge
April 2021: ask & answer
Project Health Viz
Uncover new stories by visualizing healthcare data sets provided each month.
Web: Project Health Viz
Twitter: #ProjectHealthViz
March 2021: Quantified Self
SDG Viz Project
Visualize data about Sustainable Development Goals provided by the World Health Organization.
Web: SDG Viz Project
Twitter: #TheSDGVizProject
March 2021: Goal 15- Life on Land
Preppin' Data
A weekly challenge to help you learn to prepare data and use Tableau Prep.
Web: Preppin’ Data
Twitter: #PreppinData
2021 Week 15: Restaurant Menu & Orders
Real World Fake Data
Create business dashboards using provided data sets for various industries and departments.
Web: Real World Fake Data
Twitter: #RWFD
Dataset #7: Supply Chain Manufacturing
Viz 2 Educate
Each month, create vizzes on global education syllabus topics as resources for teachers worldwide.
Web: Viz 2 Educate
Twitter: #Viz2educate
April: Arts & Music
Diversity in Data
An initiative centered around diversity, equity & awareness by visualizing provided datasets each month.
Web: Diversity in Data
Twitter: #DiversityinData
March 2021: Adaptive Sports
Viz for Social Good
Volunteer to design data visualizations that help nonprofits harness the power of data for social change.
Web: Viz for Social Good
Twitter: #VizforSocialGood
関連ストーリー
DataFam Roundup: April 15–19, 2024
 2024/04/19

DataFam Roundup: April 8–12, 2024
2024/04/12
DataFam Roundup: April 1–5, 2024
2024/04/05
Subscribe to our blog
Tableau の最新情報をメールでお知らせします