DataFam Roundup: March 12, 2021


Welcome back and happy Friday! Dig into the latest DataFam Roundup—a weekly blog post that brings together what’s trending in the community all in one post. As always, we invite you to send us your content—and the DataFam content from your peers that have inspired you! Find the content submission form here.
DataFam blog content
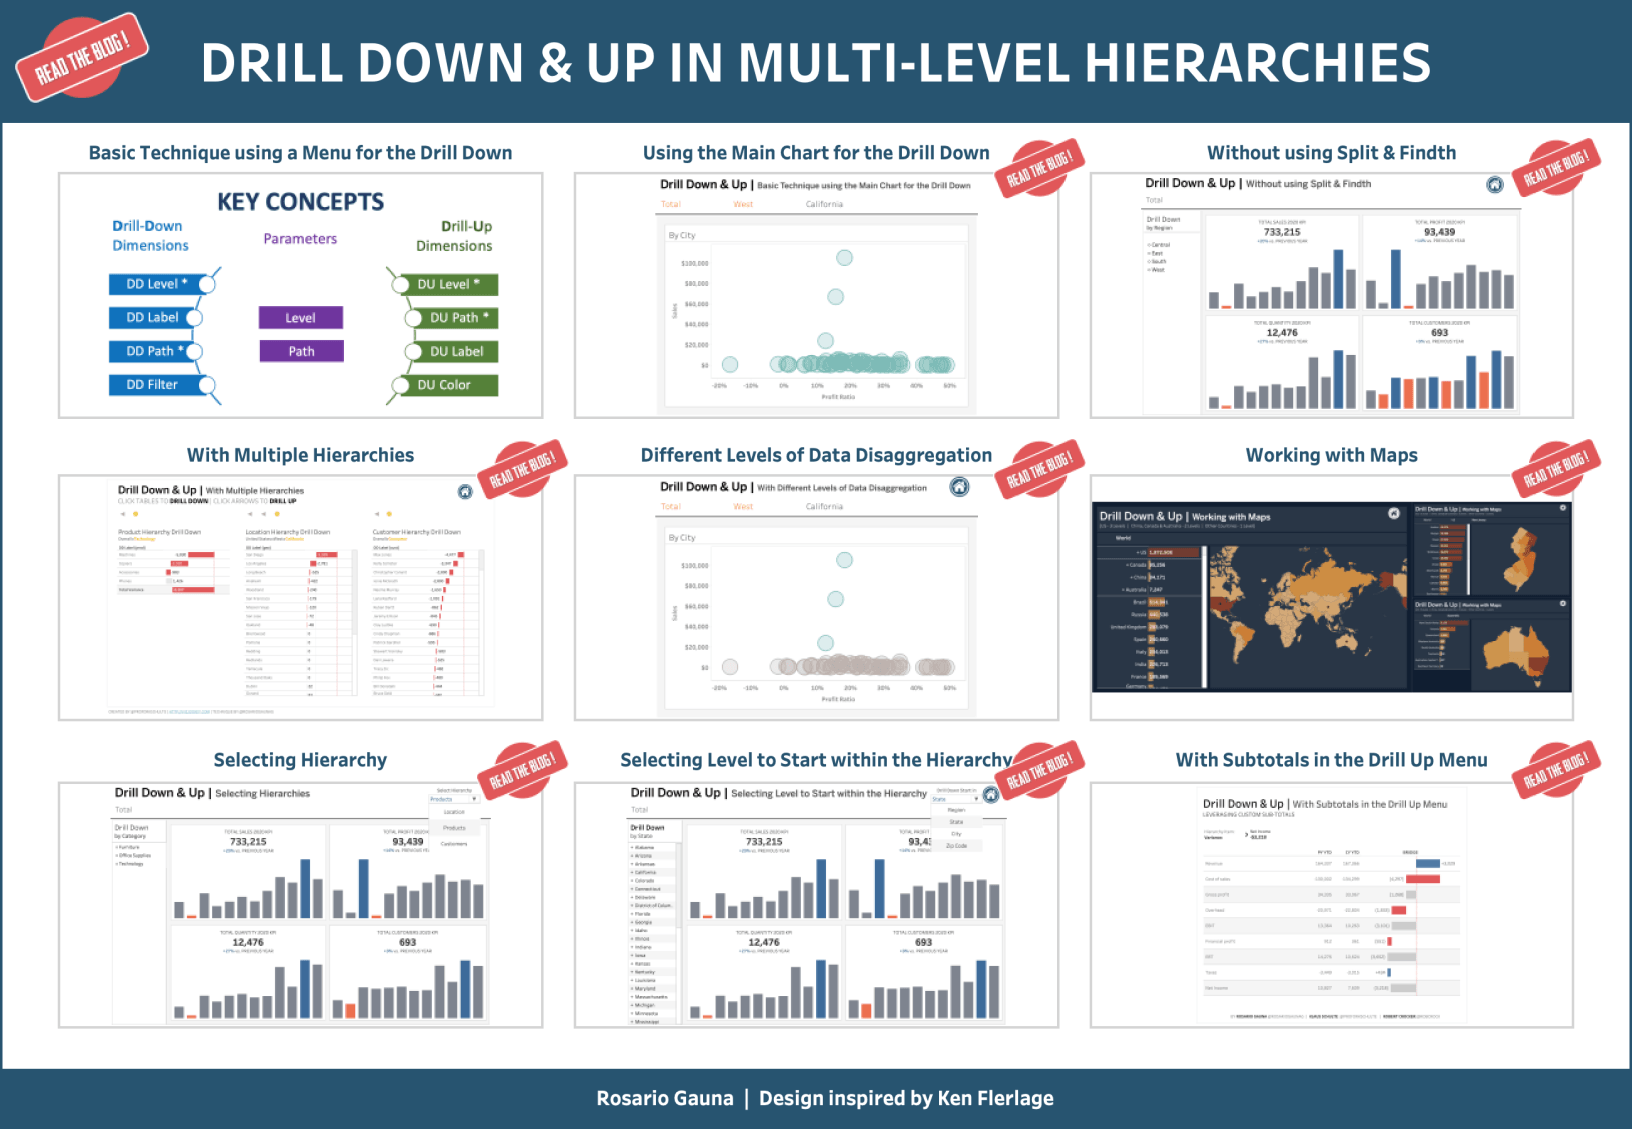
Drill Down/Up | Basic Technique in a Multi-Level Hierarchy, Rosario Gauna
Dive into content created by the Tableau Community:
- Video Learning Tableau? Follow this Playlist Donabel Santos
- Podcast Data + Love - Christina Gorga Zach Bowders
- Blog Using GitHub Pages to host your visualizations David Pires
- Blog What’s Good? Women in Data with Autumn Battani CJ Mayes
- Blog Drill Down/Up | Basic Technique in a Multi-Level Hierarchy Rosario Gauna
- Video Tableau 2021.1 preview ahead of release Tim Ngwena
- Blog COVID-19, Job Loss, and Questioning My Self Worth Allison Wright
- Blog What Makes a Good Data Leader Colm O’Grada
Upcoming events
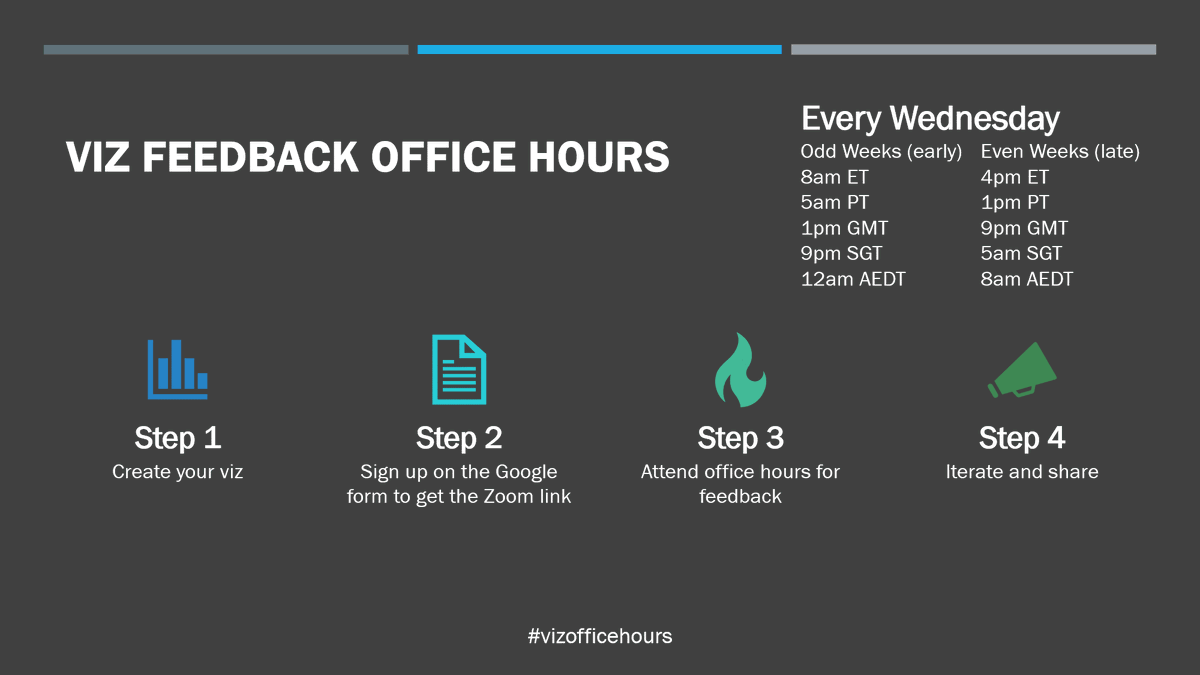
Viz Feedback Office Hours
Join an upcoming Tableau User Group event:
- March 17, 2021: #MadisonTUG Virtual
- March 18, 2021: Atlanta Tableau User Group
- March 19, 2021: Tableau Server Admins User Group
User Group Event Recording: March 10, 2021 Server Admin APAC Tableau User Group
Check out all the virtual Tableau User Group events here.
Viz Feedback Office Hours: Each week Michelle Frayman and Zak Geis will meet with community members and discuss their content. Register for a week to participate.
Vizzes
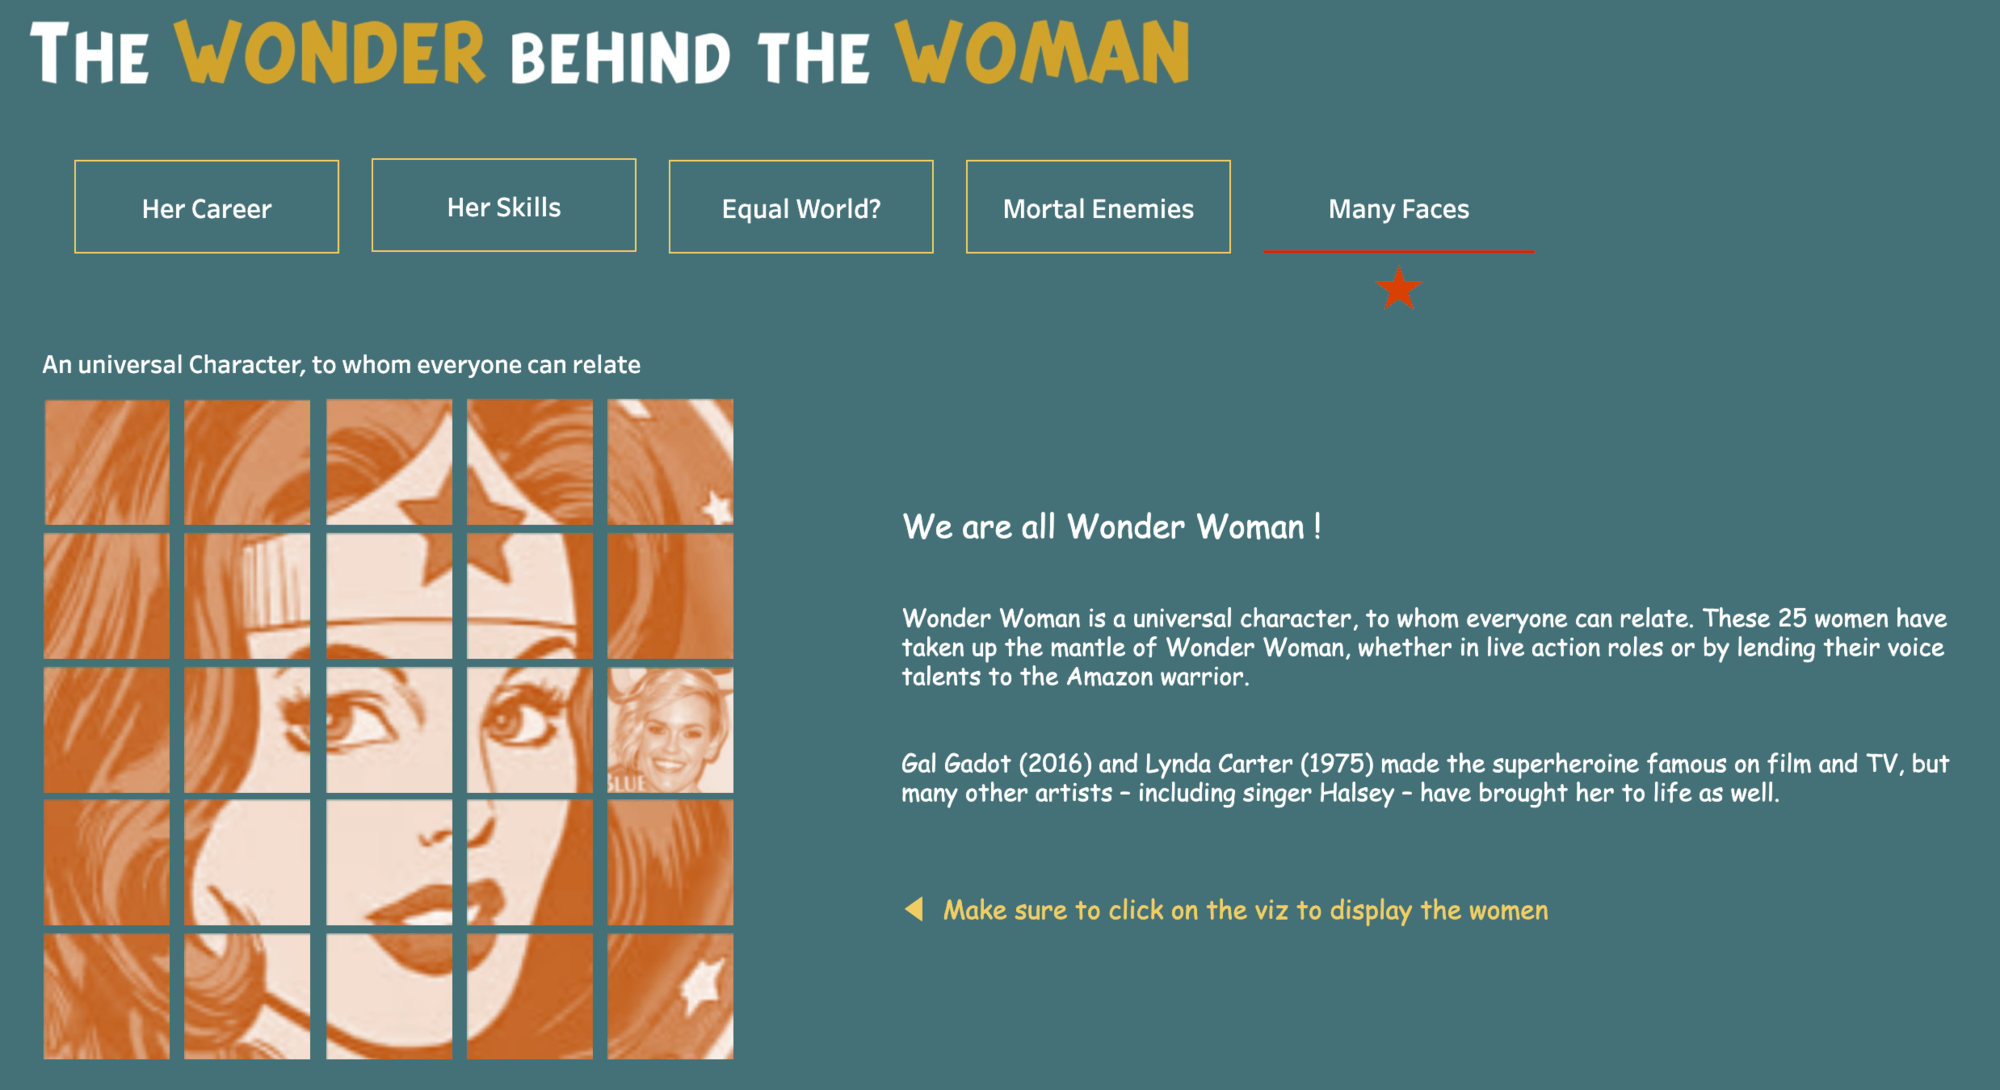
The Wonder behind the Woman, Annabelle Rincon and Joshua Preston
Catch this week’s Viz of the Days here and subscribe to get them emailed directly to your inbox.
Check out some inspirational vizzes created by the community:
- The Wonder behind the Woman Annabelle Rincon and Joshua Preston
- Happy Mario Day! Ant Pulley
- The Rise of Women in the Olympics Pratik Geoffrey Saxena
- World Air Travel - Passenger Numbers and Tourism Income Naresh Suglani
Community Projects

Stay in the loop on the Tableau Community Projects:
Makeover Monday
Join the community every Monday to work with a given data set and create better, more effective visualizations.
Web: Makeover Monday
Twitter: #MakeoverMonday
Week 10: International Women’s Day: IOC Hits New Record with 47.7% Women
Workout Wednesday
Build your skills with a weekly challenge to re-create an interactive data visualization.
Web: Workout Wednesday
Twitter: #WOW2021
Week 10: Can you build a must include filter?
Sports Viz Sunday
Create and share data visualizations using rich, sports-themed data sets in a monthly challenge.
Web: Sports Viz Sunday
Twitter: #SportsVizSunday
March 2021: Adaptive Sports
Iron Quest
Practice data sourcing, preparation, and visualization skills in a themed monthly challenge.
Web: Iron Quest
Twitter: #IronQuest
March 2021: Games
Storytelling with Data
Practice data visualization and storytelling skills by participating in monthly challenges and exercises.
Web: Storytelling with Data
Twitter: #SWDChallenge
March 2021: March MAPness
Project Health Viz
Uncover new stories by visualizing healthcare data sets provided each month.
Web: Project Health Viz:
Twitter: #ProjectHealthViz
March 2021: Adaptive Sports
SDG Viz Project
Visualize data about Sustainable Development Goals provided by the World Health Organization.
Web: SDG Viz Project
Twitter: #TheSDGVizProject
March 2021: Goal 14- Life Below Water
Preppin' Data
A weekly challenge to help you learn to prepare data and use Tableau Prep.
Web: Preppin’ Data
Twitter: #PreppinData
2021 Week 10: Pokémon Hierarchies
Real World Fake Data
Create business dashboards using provided data sets for various industries and departments.
Web: Real World Fake Data
Twitter: #RWFD
Dataset #7: Healthcare – ER
Viz 2 Educate
Each month, create vizzes on global education syllabus topics as resources for teachers worldwide.
Web: Viz 2 Educate
Twitter: #Viz2educate
February: History
Viz for Social Good
Volunteer to design data visualizations that help nonprofits harness the power of data for social change.
Web: Viz for Social Good
Twitter: #VizforSocialGood
Feb 20, 2021-Mar 14, 2021: Vera Aqua Vera Vita
Diversity in Data
An initiative centered around diversity, equity & awareness by visualizing provided datasets each month.
Web: Diversity in Data
Twitter: #DiversityinData
March 2021: Adaptive Sports
関連ストーリー

DataFam Roundup: April 8–12, 2024
 2024/04/12
DataFam Roundup: April 1–5, 2024
2024/04/05
DataFam Roundup: March 25–29, 2024
2024/03/29
Subscribe to our blog
Tableau の最新情報をメールでお知らせします