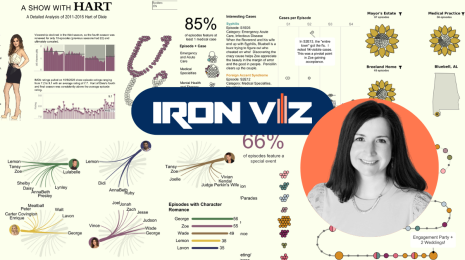
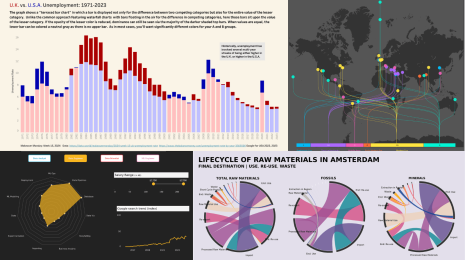
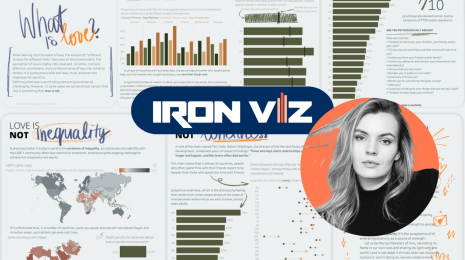
Ready to take your data skills to the next level? Iron Viz is back for 2020 with our biggest prizes yet
Iron Viz—the ultimate data competition—is back for 2020 and the prizes are bigger than ever! This year, we’re doing things a bit differently. Instead of three global qualifier contests, there will only be one global qualifier contest to determine the three finalists that will advance to the Iron Viz championship. Our hope is that consolidating the qualifiers will help to level the playing field—all participants will be required to demonstrate their skills by creating a Tableau viz based on the same theme. Additionally, there will not be a separate qualifier contest and championship for Iron Viz Europe. But did we mention the prizes? All finalists will receive cash prizes of up to $10,000. All finalists will receive cash prizes of up to $10,000. Please note, Tableau has made the decision to reimagine Tableau in-person events in new and virtual ways through 2020. As a result, the 2020 Iron Viz championship will be a virtual event held later this October (details not yet finalized).
The theme for this year’s Iron Viz qualifier contest is something that has been top of mind for many of us: Health and Wellness. Submissions will be accepted until August 4th, 2020 (11:59:59 p.m. Pacific Standard Time). For more information, keep reading (details on prizes, official rules, and participation instructions can be found on the contest page).
Check out the prizes
This year our prizes are bigger and better than ever! These prizes are based on the order of ranking in the final competition.
1st place
- $10,000 cash prize
- $5,000 donation to a nonprofit of choice
- Free registration for Tableau Conference 2021
2nd place
- $5,000 cash prize
- $2,000 donation to a nonprofit of choice
- Free registration for Tableau conference 2021
3rd place
- $2,000 cash prize
- $1,000 donation to a nonprofit of choice
- Free registration for Tableau Conference 2021
Top 10 Qualifier Scores
- Tableau swag!
- Glory!
Visualize health and wellness data
The year 2020 brought us new challenges and obstacles to overcome. During these difficult times, health and wellness is at the forefront of our minds. All of us are experiencing the effects of the global coronavirus (COVID-19) pandemic, whether we know someone that fell ill or experienced loss of income. The killings of George Floyd and Breonna Taylor have ignited a new urgency to address the long-standing history and reality of systemic racism and violence against Black people in the United States and beyond. Health and wellness means something different to each of us (see some of the inspiring examples below); there are no rules on how you choose to explore and represent this theme. For this qualifier contest, create a data visualization using Tableau and any public data set of your choosing, as long as it relates to the theme of health and wellness!
Health and wellness visualization examples
What do you want the world to see and understand about health and wellness? How do health and wellness play a role in your life? Tell a personal story about your own quantified data or choose to explore health and wellness from a broader societal angle. If you decide to take a location-based approach, your data can be global or it can be about a specific region, country, or city.
Check out these examples for some inspiration:
- Lindsay Betzendahl analyzes Autism Spectrum Disorder data
- Kate Schaub visualizes the mental healthcare system
- Eleonora Nazander shows the color of COVID-19
- Chris Love looks at racial disparity in pregnancy-related deaths
- Frederic Fery tracks his running routes
- Priya Padham records her daily mood
Not sure where to begin? Here are some data sources to get you started:
Finding the perfect data set can be difficult so we compiled a list of resources to help:
- Download and visualize your Strava data
- World Happiness Report 2020
- World Health Organization (WHO) Databases
- HealthData.gov
- The National Institute of Mental Health Data Archive
- Health Data and Statistics from the Berkley Library
- COVID-19 Data Hub
You can also check out Jacob Olsufka’s blog post on finding free data sets or read David Murphy’s blog post to pick up some tips for creating a data set of your own.
Meet the Iron Viz judges
Vizzes will be scored based on three criteria: analysis, design, and storytelling. A panel of Tableau Community Judges will score the first round determining the top 10 entries that advance to a second round of scoring by a set of guest judges. The three data rockstars with the highest score from our guest judges will win cash prizes and proceed as our 2020 finalists to compete in the virtual Iron Viz championship this October. (Please note, judges are not allowed to provide feedback on entries during the submission period. To ensure fairness, each entry will be judged by more than one judge and the average score will be used.)
Community judges
Dzifa Amexo is a Senior studying Finance and Data Analytics at Mercy College. Her passion for data and storytelling led her to become a Tableau Public Featured Author. She’s an active member of the community and regularly participates in #MakeoverMonday.
Emily Kund is the founder of The Fringe Festival and Analytics to Inform and a Tableau Social Media Ambassador. She uses analytics to help entrepreneurs learn more about their business in order to better serve their clients and communities. Emily is also a data visualization instructor.
Ken Flerlage is an analytics architect, strategist, and evangelist at Bucknell University. He is a three-time Tableau Zen Master and is an active member of the Tableau community. Ken spends a lot of time answering questions on the forums and posting on his blog that he shares with his identical twin brother and fellow Zen Master, Kevin Flerlage.
Kevin Flerlage is a Senior Analyst and Tableau Developer at Unifund, a Tableau Zen Master, and Tableau Public Ambassador. When he’s not creating vizzes on Tableau Public, Kevin co-authors a data visualization blog with his brother. He’s also co-lead of the Cincinnati Tableau User Group (Cincy TUG).
Meera Umasankar works at one of the leading retail banks in Singapore as the Assistant Vice President in Data Democratization. Meera enjoys vizzing on important social topics and has taken part in many community data projects like #MakeoverMonday and #IronQuest. She is also co-lead of the #DataPlusWomenSG community in Singapore.
Neil Richards is a Data Visualization Consultant and Evangelist at Groupon in the UK, a Tableau Zen Master, and a Tableau Public Ambassador. He is also Knowledge Director of the Data Visualization Society and a member of the board for Viz for Social Good. Neil regularly speaks at user groups and Tableau Conferences and writes on his data visualization blog.
Sarah Bartlett is a Business Intelligence and Analytics Consultant at Slalom, a Tableau Zen Master and Social Media Ambassador, and a co-lead of the London Tableau User Group. She also founded the #IronQuest challenge and was a 2018 Iron Viz Europe finalist.
Tim Ngwena is a consultant at The Information Lab. He also produces Youtube videos to help new users get to grips with Tableau and has a bi-weekly podcast called Datum that covers topics that span the technology and analytics sector.
Toan Hoang is the Managing Director and Founder of Tableau Magic. Toan is a lifelong teacher, writing tutorials about Tableau, and was honored as a Tableau Zen Master in 2020. When he’s not teaching others about data visualization, he enjoys playing piano and teaching Salsa.
Stay tuned for our surprise guest judges
Stay tuned to hear who will join us as surprise guest judges this year! You won’t be disappointed.
Learn how to enter:
Don't miss the chance to challenge yourself and compete with data enthusiasts from across the world! Here's how it works:
- Download Tableau Desktop.
- Create a Tableau Public profile.
- Get some publicly-available data. Check out the resources above or this blog post by Jacob Olsufka for tips on finding free and interesting data sets.
- Publish your visualization to your Tableau Public Profile.
- Once published, submit a link to your published visualization here.
For more information about official rules and eligibility, visit the contest page.
Remember, win or learn—you can’t lose.
NO PURCHASE NECESSARY. Open to legal residents of Argentina, Australia, Belgium, Canada (excluding Quebec), Chile, Czech Republic, France, Germany, Hungary, India, Ireland, Japan, Luxembourg, Netherlands, New Zealand, Norway, Poland, Singapore, South Korea, Spain, Sweden, the United Kingdom, or the United States who are validly registered users of Tableau Public, who have validly registered in the Contest, and who are at least the age of majority in their jurisdiction of residence at the time of entry. “Contest Period” is from 12:01 a.m. PT on 07/01/2020 through 11:59 p.m. on 08/04/2020. To enter, during the Contest Period: (a) visit https://www.tableau.com/iron-viz and register as a contestant in the Contest; (b) properly download the Tableau software and connect to any free and publicly available data set; (c) produce and publish a Tableau Public data visualization; and (d) provide the URL of the visualization to Sponsor at https://www.tableau.com/iron-viz. Three finalists will each receive the following: (i) one digital conference registration to the digital 2020 Tableau Conference (currently scheduled for October 5 - 8, 2020) (Approximate Retail Value “ARV”: $0), (ii) assorted Tableau apparel and accessories (ARV: $600); (iii) a $200 gift certificate to the Tableau Store (ARV: $200); and (ii) qualification to participate in the final. Seven (7) runners-up will each receive a $200 gift certificate to the Tableau Store (ARV: $200). Odds of winning depend on number and quality of eligible entries. Contest subject to Official Rules. Details and restrictions apply, so visit https://www.tableau.com/iron-viz for Official Rules. Sponsor: Tableau Software, Inc.
関連ストーリー
Subscribe to our blog
Tableau の最新情報をメールでお知らせします


