Best of the Tableau Web: Stream graphs, visualizing music, string calculations, and more
Check out the Best of the Tableau Web from September!


Welcome to the monthly review of the best of the Tableau blogging community. Did you know it's been nearly 6 years since I first wrote one of these posts? I've learnt so much from the incredible contributions made by people like you. Whether you’re creating vizzes with synchronized scrolling across multiple sheets, or adding dimension with reference bands behind scatter charts, or creating custom segmentation with string calculations, you’re teaching me—and the entire community—all new ways to think about, process, and visualize data.
This month is... (drumroll, please) Tableau Conference (aka TC) in New Orleans from October 22 to October 25. Not only is TC a chance to choose from hundreds of sessions to learn about Tableau and all things data, it's also a chance to connect with the Tableau community. One of my favorite things to do at conference is to meet some of the people whose blog posts have inspired me over the year. Meeting community members in real life is a rewarding part of the conference, and helps you create a strong network that will support you in your lifelong viz skills and career. There will be a large area of Data Village dedicated to community—use this space as a hub to find and meet bloggers, attend meetups, and make new friends. Another opportunity to meet with and learn from fellow data lovers is in the Fanalytics breakout where you can participate in group viz building and engaging discussions. Or experience Makeover Monday live in-person with Eva Murray and Andy Kriebel and other community members.
With that, I am happy to present another great list of Tableau posts for you to enjoy:
Tips and tricks
Ken Flerlage SQL for Tableau Part 1: The Basics
learningtableaublog #TakeapartTuesday Bars inside a 100% box
Ellen Blackburn Connecting to Data: Extract or Live?
Luisa Bez Why you should never hard-code in Tableau
Ryan Sleeper An Introduction to String Calculations in Tableau
Data + Science Optimizing Tableau Workbooks
#Coffeetableviz A looksie at UCAS placed applicants
Inspiration
TableauFit Translating Action into Design
Tableau Junkie Fitbit Web Data Connector 2.0
Datasaurus-Rex What is Tableau?
Questions in Dataviz How do we visualise music?
mikevizneros Recognizing and Avoiding Pitfalls (TC18 Director's Cut #1)
Jedi
Practical blog for Viz Enthusiasts WorkoutWednesday S02 E35 – 2×2 quadrant chart
RosarioViz Scatter Plot Reference Bands
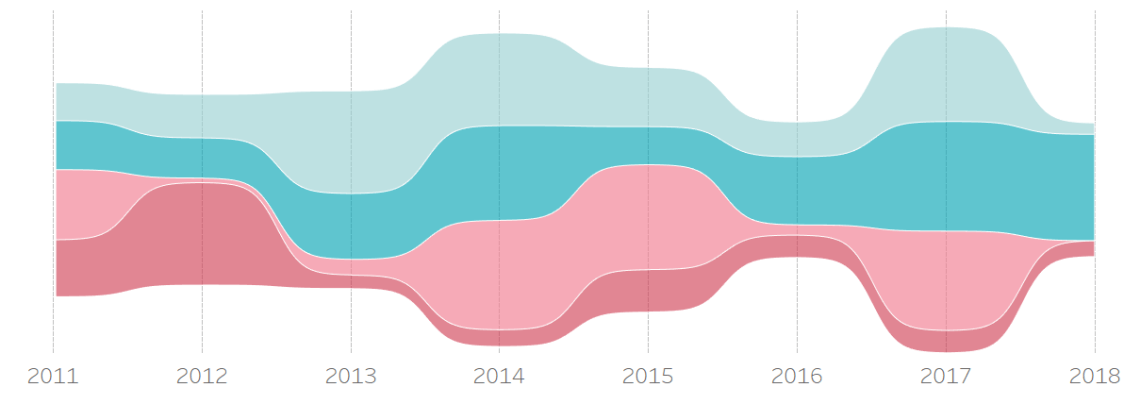
greatified How to build a Stream Graph in Tableau Software
VIZJOCKEY Custom Scroll Control for Synchronized Scrolling
Server
Timo Tautenhahn Tableau Server – How to see who deleted a workbook?
Code
The Last Data Bender Tableau and Snowflake Boolean fields
関連ストーリー
Meet Iron Viz 2024 Finalist Chris Westlake
 2024/04/22
DataFam Roundup: April 15–19, 2024
 2024/04/19

Meet Iron Viz 2024 Finalist Jessica Moon
2024/04/15
Subscribe to our blog
Tableau の最新情報をメールでお知らせします