DataFam Roundup: March 21 - 25, 2022


Welcome! Dig into this week's DataFam Roundup—a weekly blog that brings together community content all in one post. As always, we invite you to send us your content—and the DataFam content from your peers that have inspired you! Find the content submission form here.
DataFam content
Alexander Mou, Vizible Difference: Filtering Partial Date Period in Tableau
Dive into content created by the Tableau Community:
- Jeffrey A. Shaffer, data+science: How to Create a Custom Mapbox Map with Zoom in to Satellite View for Tableau
- Autumn Battani, Make It Make Sense: Ten Tiny Tableau Tips Pt. 2
- Techi Anshi: Tableau dashboard in 5 mins
- Ken Flerlage, The Flerlage Twins: Tableau Data Sources Part 1: Data Source Types
- Mark Brandourne, Just 5 Minutes: Right Where I'm Suppose to Be...
- Anthony B. Smoak, Data & Analytics: Top 10 Functions in Tableau You Need to Know
- Marc Reid: How to create flight paths in Tableau by drawing lines & points on a map with MAKEPOINT and MAKELINE
- Japan Tableau User Group
- Tabjoが贈るたぶ筋トレーニング。 お役立ちTips100本ノック!WorkOutWednesday mini#2 Hands-on Tips and Tricks event (Japanese)
- Satoshi Ganeko, Toshiya Kijima, Toshiya Kijima: Ganeko(我如古)さんのVizの魅力ー数学と着想力の源ー TableauPublicで活躍している4人の達人が語ります(我如古聡志×さかぴー×Null×ハラヨワ)Tableau Viz Exhibition”Life” 〜日常にデータを〜 is a new community project where people submit their data visualizations based on data from their everyday life. Project leaders select vizzes for the exhibition at the cafe. This virtual event featured 4 Tableau Public authors to discuss their creativity and inspirations. (Japanese)
- Nicole Klassen, Mighty Canary:
- Alexander Mou, Vizible Difference: Filtering Partial Date Period in Tableau
- Jacqui Moore, Do Mo(o)re With Data: It Depends: Using design tools in your dashboard design process
- Sarah Bartlett, Sarah Loves Data: Iron Quest – Music Firsts
- Dawn Harrington, Tech Tips Girl:
- Ritesh Bisht, Ritesh is Dancing with Data: 2022 New Feature Workbook Optimizer - Tableau Performance improvement
Team Tableau
- Who are the finalists of the 2022 Iron Viz Qualifiers?
- Celebrating Women's History Month with the Tableau Community
- Announcing the 2022 Tableau Visionaries
Upcoming events and community participation
- Stay up to date with the latest and greatest from the Tableau Community. We'll help you along in your Tableau journey, bring your data skills to the next level, and nurture powerful connections.
- Sign up to be a panelist for the 3charts@3 Live: A Mystery Chart Show featuring topics like personal finance, energy, healthcare and more!
- March 23: The #DuBoisChallenge Episode
- Watch the recording: Women's History Month Episode
- Calling all DataDevs: Join Tableau at TrailblazerDX 2022, April 27–28 in San Francisco—or virtually from anywhere—to boost your skills and celebrate with other builders, creators, and makers.
- Your Future in Data Analytics, Maggy (Martina) Muellner: aims to support the next generation of DataFam members in gaining/improving their Tableau skills, support them in making their resume "hire friendly" and give advice on personal marketing on LinkedIn.
Vizzes
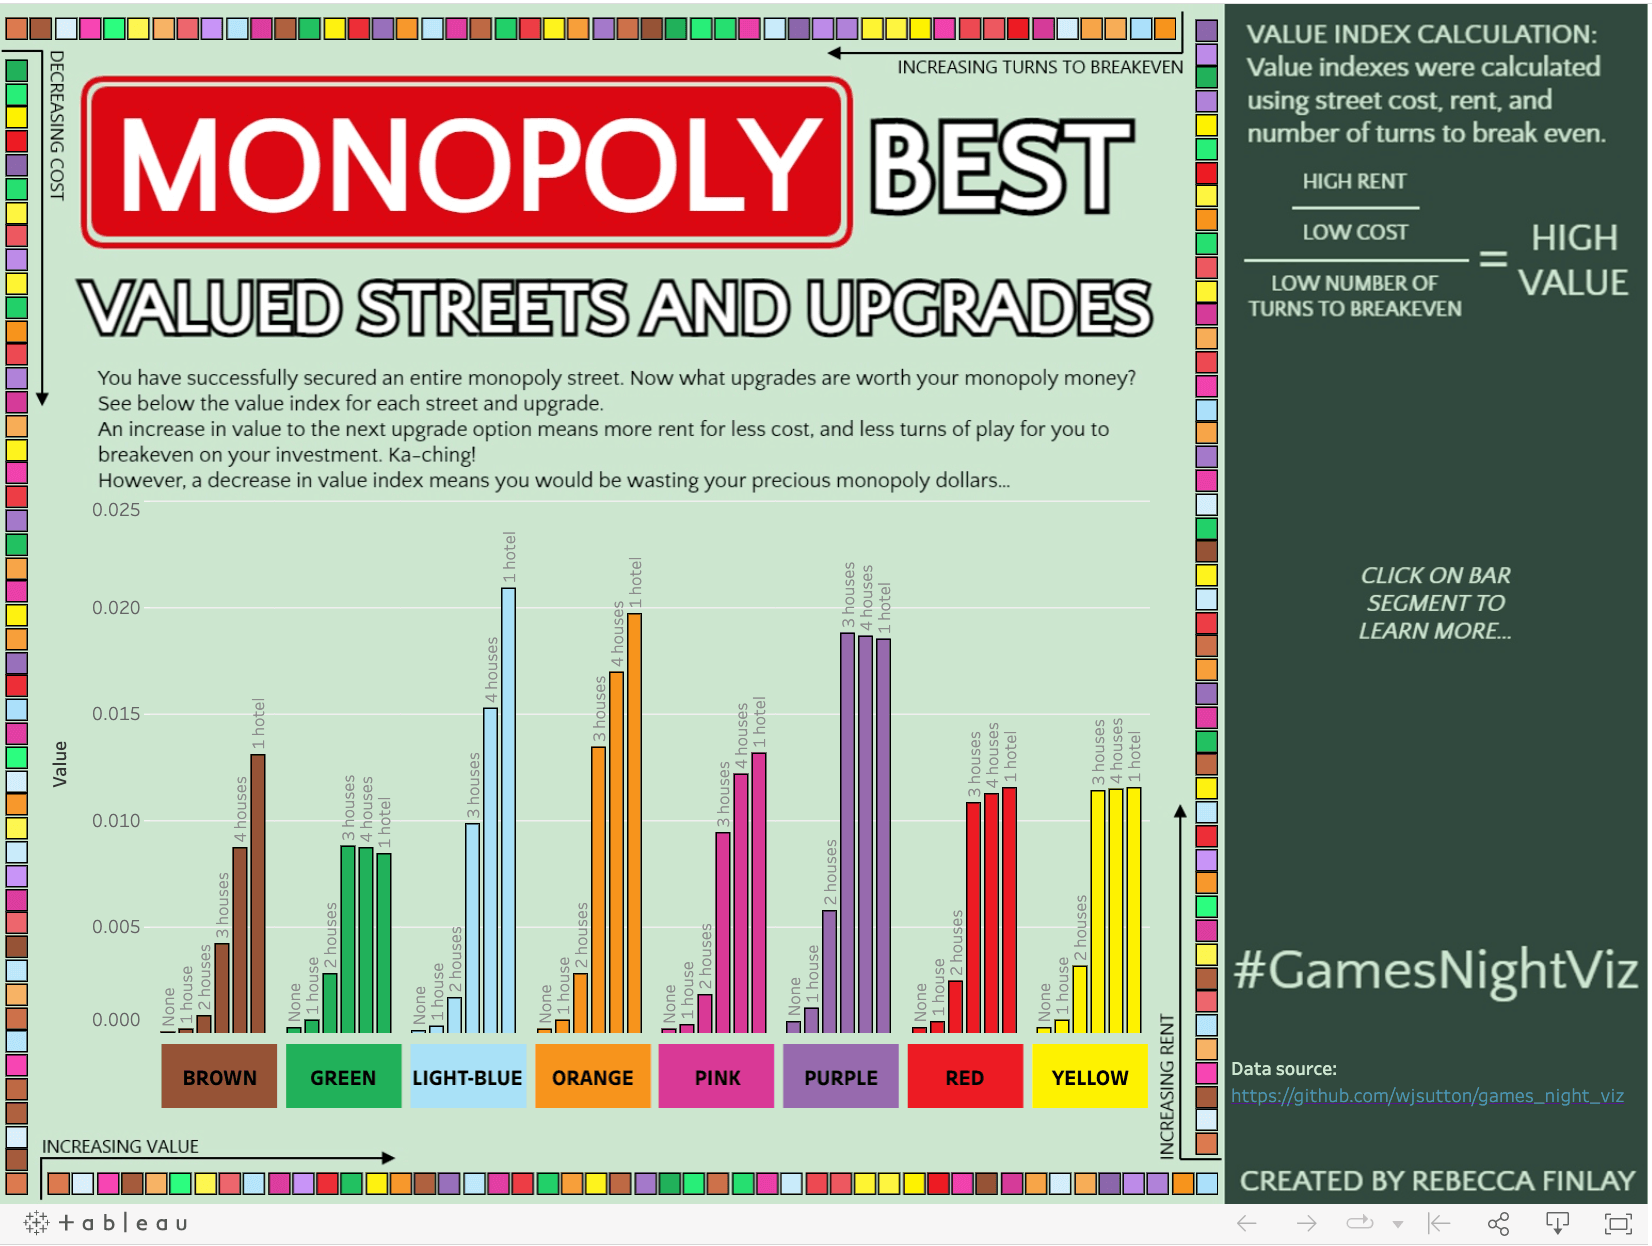
Rebecca Finlay: Monopoly's Best Valued Streets and Upgrades
Catch this week’s Viz of the Days here and subscribe to get them emailed directly to your inbox.
Check out some inspirational vizzes created by the community:
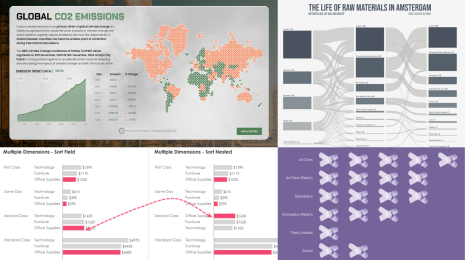
- Samuel Parsons: 2022 Six Nations Player Performance
- Brian Moore: Office Relationships
- Rebecca Finlay: Monopoly's Best Valued Streets and Upgrades
Community Projects
DataFam Con
A monthly challenge covering pop culture and fandoms.
Web: DataFam Con
Twitter: #DataFamCon
February 2022: Toss a Coin to your Witcher …
EduVizzers
A monthly project connecting real education data with real people.
Web: Eduvizzers
March 2022:
- Level 1 dataset: IPEDS University Admissions Data
- Level 2 dataset: IPEDS University Directory Data
Back 2 Viz Basics
A bi-weekly project helping those who are newer in the community and just starting out with Tableau. Not limited just to newbies!
Web: Back 2 Viz Basics
Twitter: #B2VB
Week 6: Dealing with Outliers
Data Plus Music
A monthly project visualizeing the data behind the music we love!
Web: Data Plus Music
Twitter: #DataPlusMusic
February 2022: MIDI Music Analysis
Games Night Viz
A monthly project focusing on using data from your favorite games.
Web: Games Nights Viz
Twitter: #GamesNightViz
March 2022: Level 3: Powering Up
Workout Wednesday
Build your skills with a weekly challenge to re-create an interactive data visualization.
Web: Workout Wednesday
Twitter: #WOW2022
Week 12: Can you create a jittered boxplot?
Preppin' Data
A weekly challenge to help you learn to prepare data and use Tableau Prep.
Web: Preppin’ Data
Twitter: #PreppinData
Week 12: Gender Pay Gap
Iron Quest
Practice data sourcing, preparation, and visualization skills in a themed monthly challenge.
Web: Iron Quest
Twitter: #IronQuest
March 2022: Music Firsts
Storytelling with Data
Practice data visualization and storytelling skills by participating in monthly challenges and exercises.
Web: Storytelling with Data
Twitter: #SWDChallenge
March 2022: qualitative data
Project Health Viz
Uncover new stories by visualizing healthcare data sets provided each month.
Web: Project Health Viz
Twitter: #ProjectHealthViz
January 2022: One Year of Sleep
Diversity in Data
An initiative centered around diversity, equity & awareness by visualizing provided datasets each month.
Web: Diversity in Data
Twitter: #DiversityinData
March 2022: Refugees in Ukraiune and Women in the Global Workforce
SDG Viz Project
Visualize data about Sustainable Development Goals provided by the World Health Organization.
Web: SDG Viz Project
Twitter: #TheSDGVizProject
Sports Viz Sunday
Create and share data visualizations using rich, sports-themed data sets in a monthly challenge.
Web: Sports Viz Sunday
Twitter: #SportsVizSunday
March 2022: Women in Data
Viz for Social Good
Volunteer to design data visualizations that help nonprofits harness the power of data for social change.
Web: Viz for Social Good
Twitter: #VizforSocialGood
Mar 8, 2022 - Mar 29, 2022: Tap Elderly Women's Wisdom for Youth (TEWWY)
Real World Fake Data
Create business dashboards using provided data sets for various industries and departments.
Web: Real World Fake Data
Twitter: #RWFD
Session 1: Expert, Basic
Viz 2 Educate
Each month, create vizzes on global education syllabus topics as resources for teachers worldwide.
Web: Viz 2 Educate
Twitter: #Viz2educate
February 2022: Food & Nutrition
Makeover Monday
Join the community every Monday to work with a given data set and create better, more effective visualizations.
Web: Makeover Monday
Twitter: #MakeoverMonday
Storie correlate

DataFam Roundup: April 8–12, 2024
 12 Aprile, 2024
DataFam Roundup: April 1–5, 2024
5 Aprile, 2024
DataFam Roundup: March 25–29, 2024
29 Marzo, 2024
Subscribe to our blog
Ricevi via e-mail gli aggiornamenti di Tableau.