DataFam Roundup: July 12 - July 16, 2021


Dig into the latest DataFam Roundup—a weekly blog that brings together community content all in one post. As always, we invite you to send us your content—and the DataFam content from your peers that have inspired you! Find the content submission form here.
DataFam content
Dive into content created by the Tableau Community:
- Vani Agarwal, Tableau Tips and Tricks: Tableau + Figma - A Match Made in Heaven?
- Clive (Benny) Benford: What does a Data Office look like and why is it mission critical and exciting?
- Prasann Prem: An intro to "Tableau Buddy"
- Pearle Lundeen: 5 Reasons to nominate a Tableau Ambassador Today
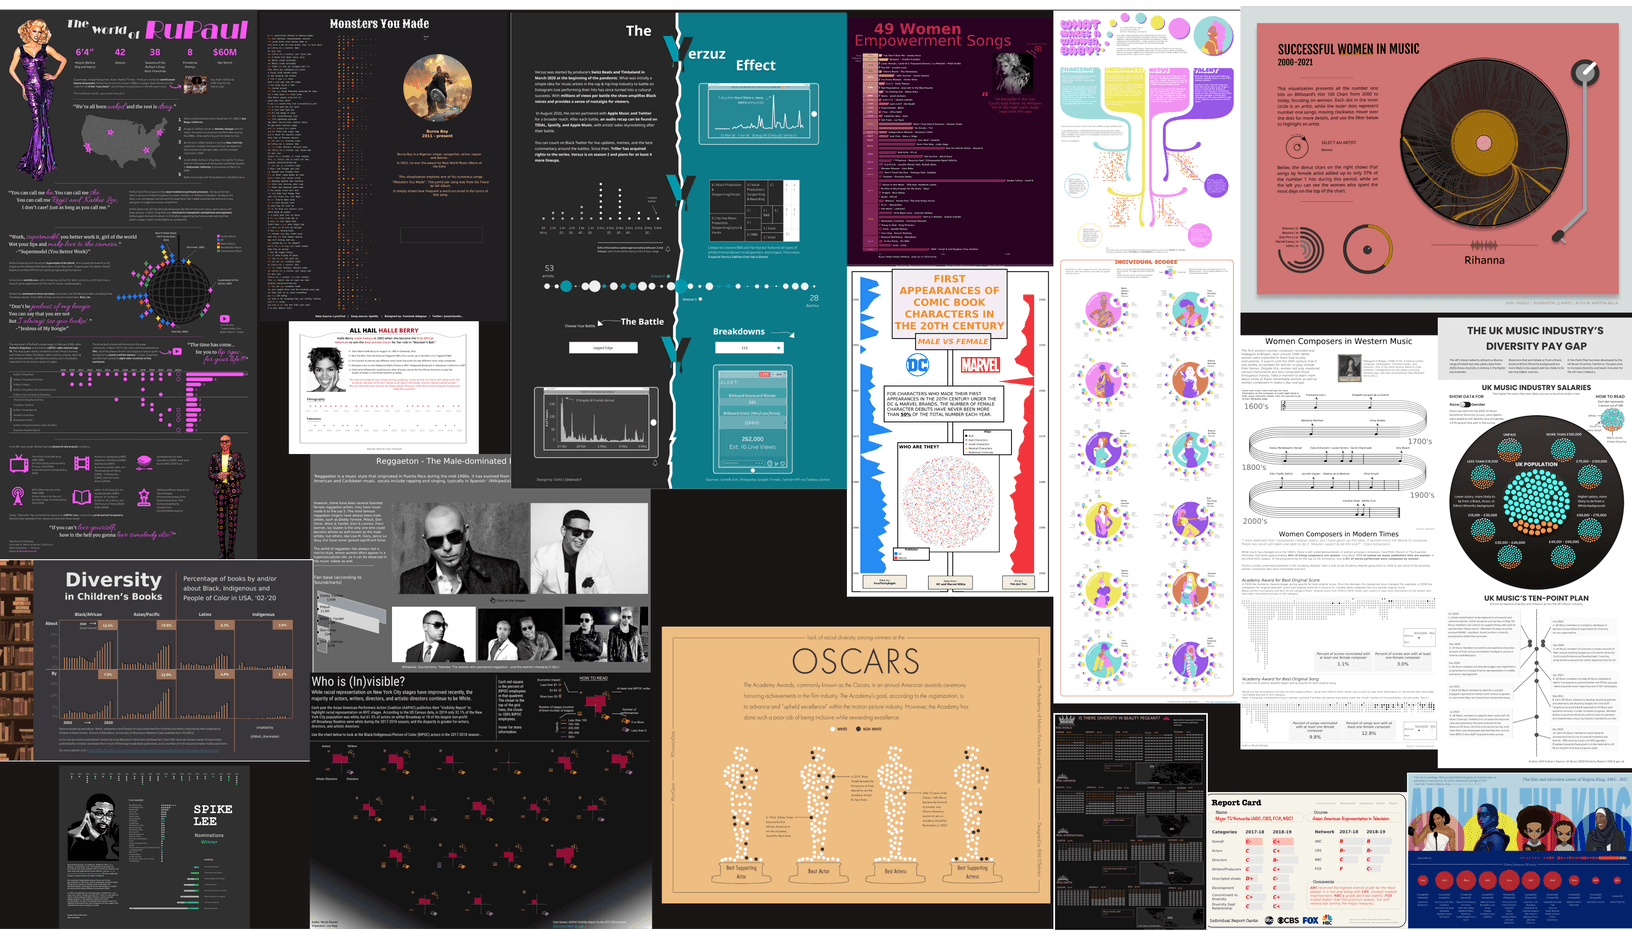
- Sarah Bartlett, Sarah Loves Data: Iron Quest Diversity in Entertainment Recap
- Steve Wexler, Data Revelations: What's New in Visualizing Survey Data Using Tableau (July 8, 2021)
- Ella Worsdale, Dataliciously Ella: Improving team engagement
- Eva Murray: Driving data sharing inside your organisation
- Keshia Rose, Slice of Keesh: A Quick Tableau Data Source Mapper
Upcoming events and community participation
- On July 27, as part of our Industries Week celebrating Team USA competing in the Tokyo Games, we’re highlighting the #SportsVizSunday monthly challenge. Watch as Zen Master and Social Ambassador Simon Beaumont creates a gold medal-winning visualization, from scratch, within 20 minutes. Or to put it another way, in less time than it takes to break the current 10,000 meters World Record! Enjoy expert viz commentary, an intro to Sports Viz Sunday, the Tableau Community, and Tableau Public━and decide if Simon’s viz is worthy of the top step on the podium. Register now.
- Join an upcoming Tableau User Group event by checking out all the virtual Tableau User Group events here
- Forums Unanswered Questions Blitz: For the month of July we are hosting a Blitz where we focus on tackling any Unanswered Questions in our Community.
Vizzes

Catch this week’s Viz of the Days here and subscribe to get them emailed directly to your inbox.
Check out some inspirational vizzes created by the community:
-
Jeff Plattner: Tableau Dashboard Layout Templates
-
Naresh Suglani: F1 Silverstone Grand Prix | Lewis Hamilton #F1

Makeover Monday
Join the community every Monday to work with a given data set and create better, more effective visualizations.
Web: Makeover Monday
Twitter: #MakeoverMonday
Week 28: UK Vaccine Coverage by Age and Ethnicity
Workout Wednesday
Build your skills with a weekly challenge to re-create an interactive data visualization.
Web: Workout Wednesday
Twitter: #WOW2021
Week 28: Can you build an app to visualize wildfires?
Sports Viz Sunday
Create and share data visualizations using rich, sports-themed data sets in a monthly challenge.
Web: Sports Viz Sunday
Twitter: #SportsVizSunday
July 2021: The Olympics
Iron Quest
Practice data sourcing, preparation, and visualization skills in a themed monthly challenge.
Web: Iron Quest
Twitter: #IronQuest
Storytelling with Data
Practice data visualization and storytelling skills by participating in monthly challenges and exercises.
Web: Storytelling with Data
Twitter: #SWDChallenge
July 2021: exploring unit charts
Project Health Viz
Uncover new stories by visualizing healthcare data sets provided each month.
Web: Project Health Viz
Twitter: #ProjectHealthViz
SDG Viz Project
Visualize data about Sustainable Development Goals provided by the World Health Organization.
Web: SDG Viz Project
Twitter: #TheSDGVizProject
Goal 17: Partnerships for the Goals
Preppin' Data
A weekly challenge to help you learn to prepare data and use Tableau Prep.
Web: Preppin’ Data
Twitter: #PreppinData
Week 27: NBA Draft Lottery calculator
Real World Fake Data
Create business dashboards using provided data sets for various industries and departments.
Web: Real World Fake Data
Twitter: #RWFD
Dataset #12: Hospitality
Viz 2 Educate
Each month, create vizzes on global education syllabus topics as resources for teachers worldwide.
Web: Viz 2 Educate
Twitter: #Viz2educate
Topic: Microbiology
Diversity in Data
An initiative centered around diversity, equity & awareness by visualizing provided datasets each month.
Web: Diversity in Data
Twitter: #DiversityinData
June 2021: Pride Month
Viz for Social Good
Volunteer to design data visualizations that help nonprofits harness the power of data for social change.
Web: Viz for Social Good
Twitter: #VizforSocialGood
Storie correlate

DataFam Roundup: April 8–12, 2024
 12 Aprile, 2024
DataFam Roundup: April 1–5, 2024
5 Aprile, 2024
DataFam Roundup: March 25–29, 2024
29 Marzo, 2024
Subscribe to our blog
Ricevi via e-mail gli aggiornamenti di Tableau.