Pride Viz Gallery: Bo McCready


Pride Month is a celebration of the impact that the LGBTQ+ community has had on making this world a better place. We are thrilled to be launching a new Pride exhibition in the Tableau Public Viz Gallery during the month of June - we hope you’ll take the time to explore the gallery and walk away feeling like you learned something new.
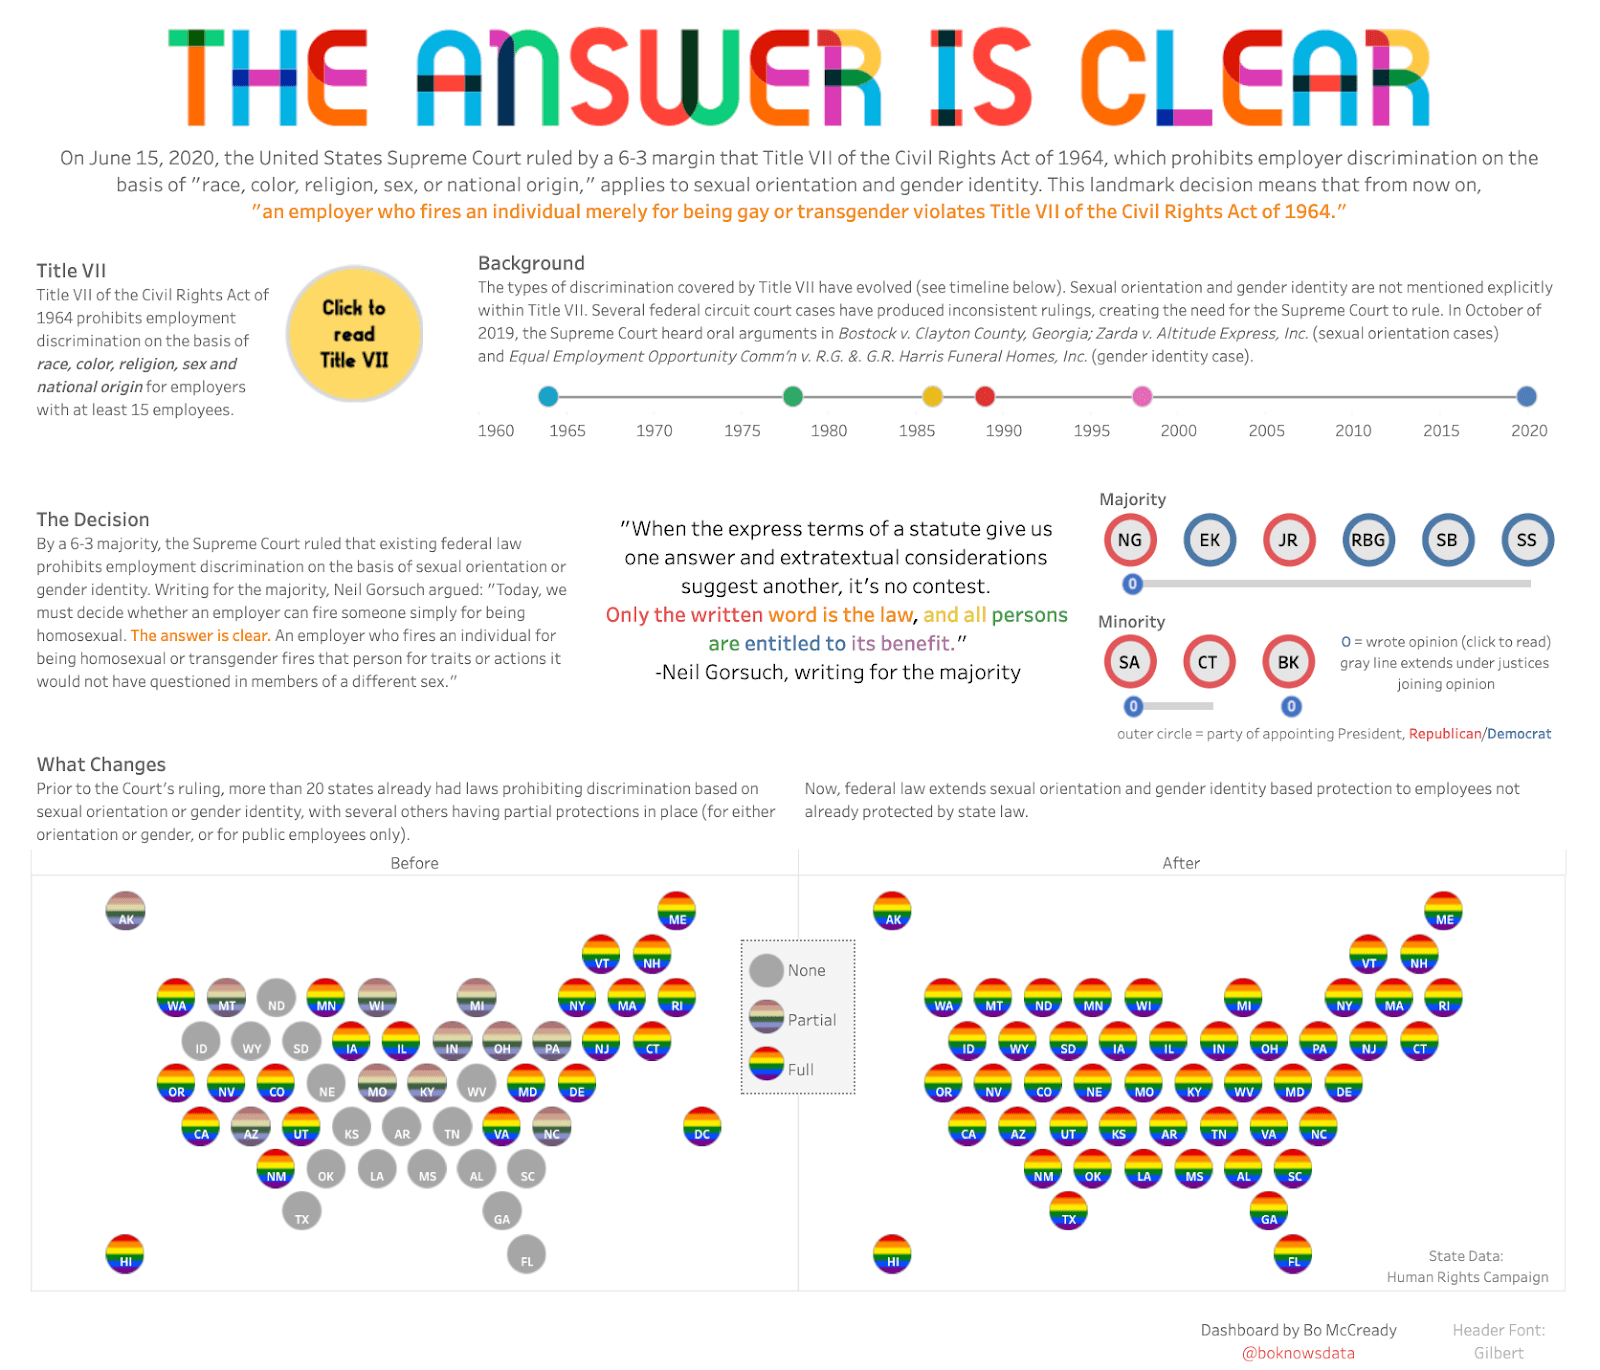
This week we sat down with Bo McCready, one of the authors featured in this year’s pride exhibition, to talk about his viz ‘The Answer is Clear: Title VII and LGBTQ+ Employees’ and his experiences with the Tableau Community.
We are also looking forward to hosting our next Data + Diversity event at the end of June - for updates check here.
Before we get started, tell us about yourself and your involvement with the Tableau Community.
I started using Tableau in 2012 but didn’t really get involved in the Tableau Community until 2018, when I had the opportunity to participate in a “tip battle” at TC18 alongside many current and future Zen Masters. From there, I started exploring the creative potential of Tableau! I’ve focused a lot on trying to reach new audiences with data visualization, so people probably know me most from the Tableau projects I’ve shared on Reddit, which have reached the front page many times. Through Tableau Public and the broader online Tableau community, I’ve made great friends and been able to take my career in new directions that never would have been possible without this community!
We recently launched a Pride exhibit in the Tableau Public Viz Gallery and your viz ‘The Answer is Clear: Title VII and LGBTQ+ Employees' was featured. Can you tell us a bit about what inspired you to create this visualization?
I wanted to work on this project because the Bostock, Zarda, and EEOC Supreme Court decisions last June really felt like a historic moment. I wasn’t just happy with the decisions themselves, I also had some faith restored in our institutions because I didn’t necessarily expect the Court to reach the conclusions they did, so it was a relief to see that politics didn’t outweigh the law in this case. I identify as straight, so I didn’t want to make anything that focused too heavily on the lived experience of being LGBTQ+ because that’s not my story to tell. But I did my master’s in public policy and took some law classes along the way, so taking this approach and highlighting the legal/policy implications felt like I was still within my wheelhouse.
While you were creating this visualization, what were some of the findings that struck you the most?
The biggest thing that stuck out to me was the decision itself! I think the Supreme Court is now perceived as highly partisan so when a major case comes before the Court, a lot of people assume justices will side with the sentiment of the party that appointed them—but I’m so glad that was the case.
When we were building out the Tableau Pride exhibit we found that there weren’t a ton of visualizations out there compared to other topics. I’m curious how you found this data source, any tips for others who are looking to visualize diversity data and places they may be able to look?
For this project, I actually built my data source from scratch! I used information from a few different websites including the Human Rights Campaign and made my own spreadsheets. I’d encourage anyone who can’t find a dataset for the topic they want to work on to start small and try making their own; there’s actually not a ton of data behind this viz and it was pretty easy to put together!
Are there any other diversity-related visualizations you’ve seen on Tableau Public that have stood out to you over the last year? If so, which ones?
I really like Autumn Battani’s viz on diversity in film. I always love film-related projects and I think this one has such a simple and elegant design.
Knowing what you know now, what would you tell yourself as a beginner creating vizzes with Tableau Public?
First, I’d want to let myself know that investing in the journey is totally worth it. I’ve seen Tableau Public transform careers and lives for myself and many others. It takes time, effort, and love, but you’ll get back what you put in and then some!
Next, I’d remind myself to have fun! If you’re enjoying what you’re doing, it will show in your vizzes and it will show in your interactions with others. If you need to take a break, then take a break! The platform and the community will still be there when you come back!
Storie correlate

Meet Iron Viz 2024 Finalist Jessica Moon
 15 Aprile, 2024

Meet Iron Viz 2024 Finalist Pata Gogová
8 Aprile, 2024

Student to BI Analyst, How Tableau Can Lead to a Successful Data Career
 20 Marzo, 2024
Subscribe to our blog
Ricevi via e-mail gli aggiornamenti di Tableau.