Pride Viz Gallery: Šárka Hubáček


Pride Month is a celebration of the impact that the LGBTQ+ community has had on making this world a better place. We are thrilled to be launching a new Pride exhibition in the Tableau Public Viz Gallery during the month of June - we hope you’ll take the time to explore the gallery and walk away feeling like you learned something new.
This week we sat down with Šárka Hubáček, one of the authors featured in this year’s pride exhibition, to talk about her viz ‘Love is love: LGBTQ+ rights around the world’ and her experiences with the Tableau Community.
We are also looking forward to hosting our next Data + Diversity event at the end of June - for updates check here.
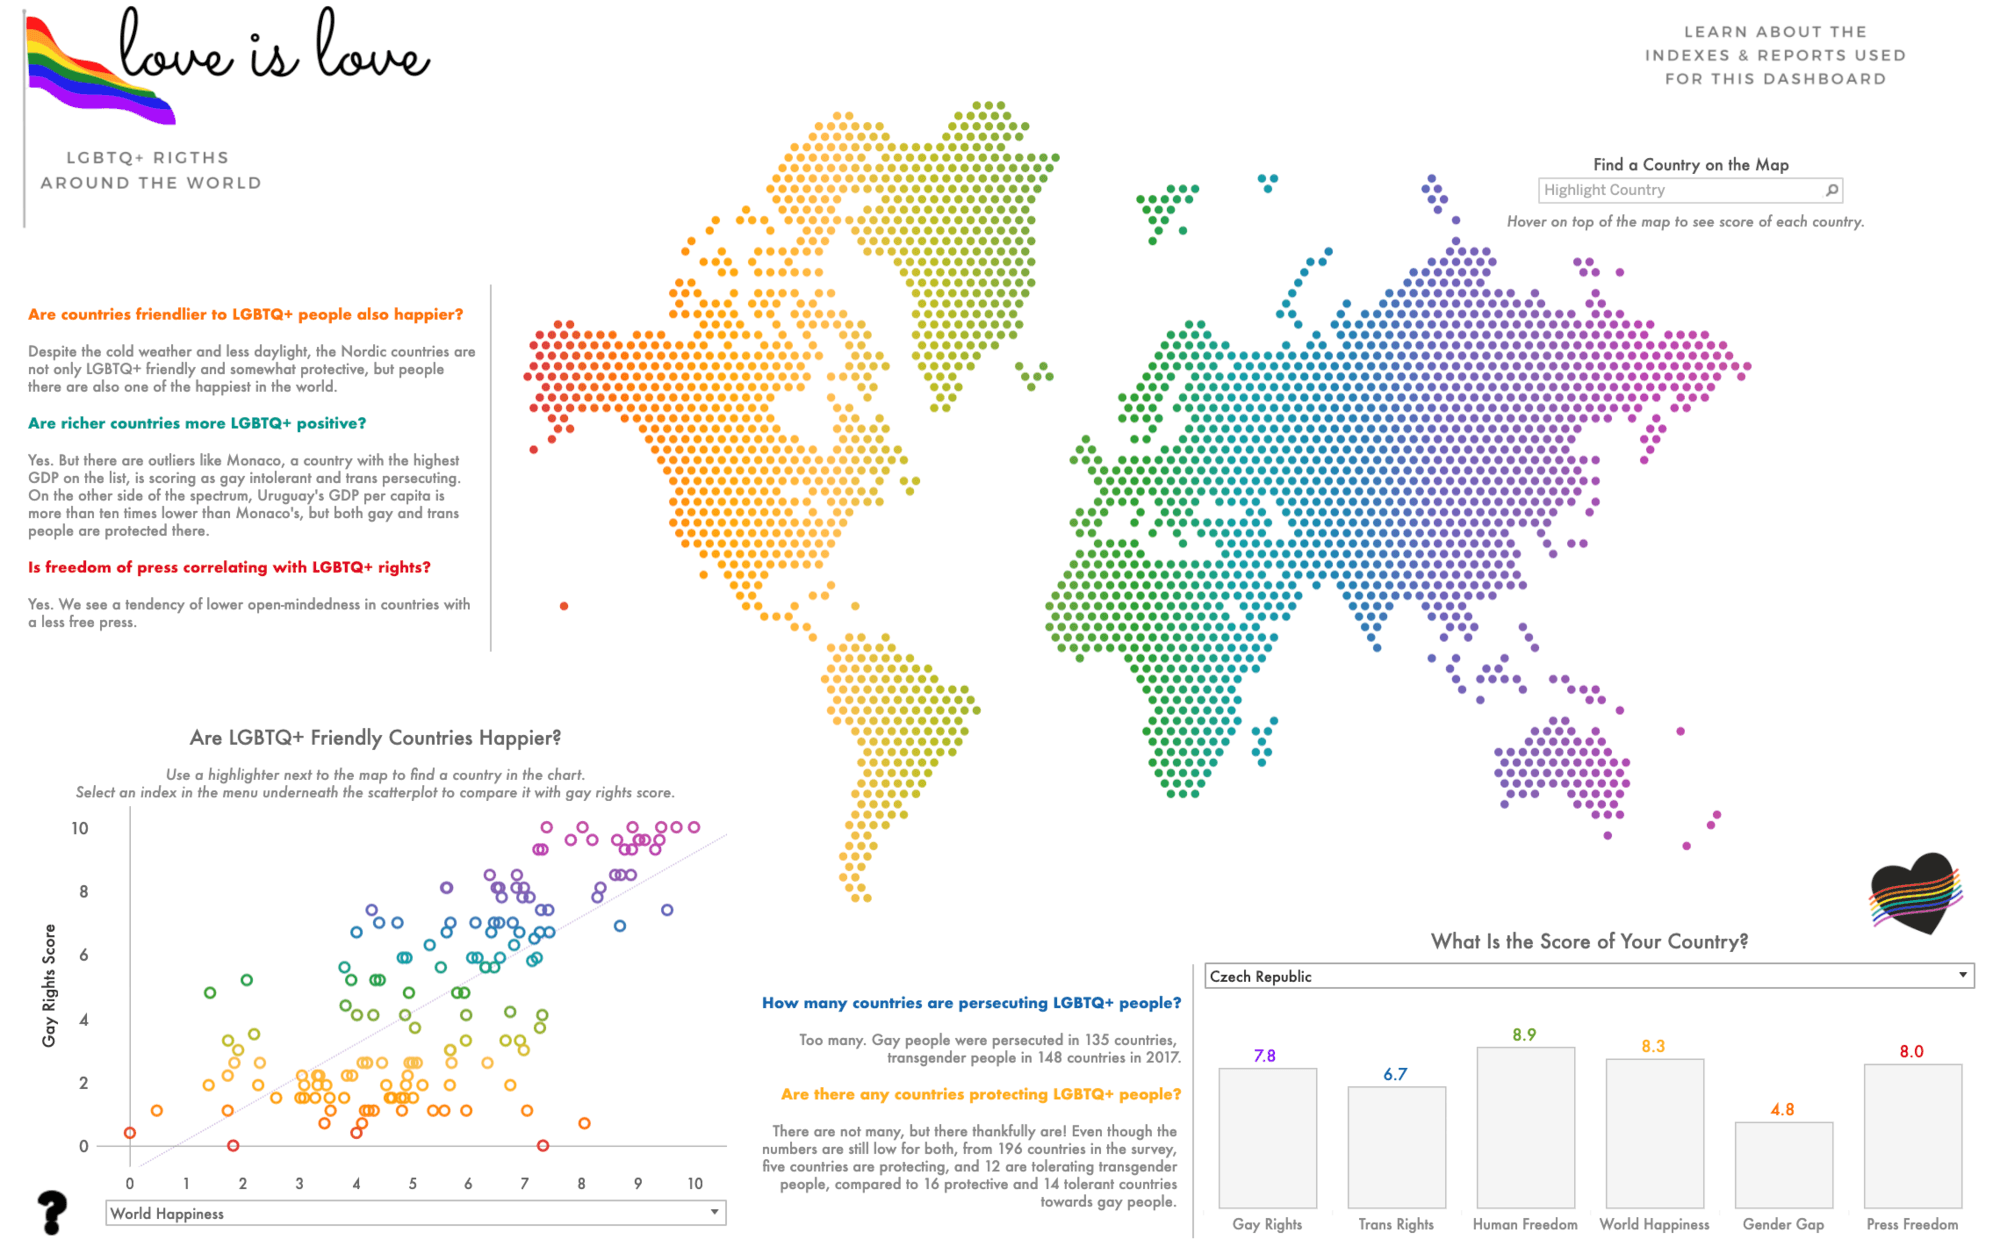
Šárka Hubáček's visualization: Love is love: LGBTQ+ rights around the world
Before we get started, tell us about yourself and your involvement with the Tableau Community.
I've been working as a data analyst for about two years now. I was doing Tableau reporting for one of the top 4 banks in Australia for a year and a half, but this year, I moved to the nonprofit sector focusing on human rights. I still build Tableau dashboards, but the topic and approach to the visual side of things are quite different.
I love Tableau Public, and Viz of the Day is an email I'm honestly looking forward to every day. For me, it's a great place for inspiration and learning what is possible to do in Tableau. It's truly amazing to see how active and excited the community is. Being data-driven has been a buzzword for quite some time, but seeing people use their usual work tool for creating something fun or educational, gives it true meaning again.
What is your favorite thing about Tableau Public?
I think the fact that people are avid to share their work. I enjoy learning from others. Honestly, it often makes my life so much easier. I'm not good at trigonometry; therefore, creating all the cool stuff using radius and pi would be painful. This way, I can follow steps someone smarter took before me. And that's awesome!
We recently launched a Pride exhibit in the Tableau Public Viz Gallery and your viz 'Love is love: LGBTQ+ Rights Around the World' was featured. Can you tell us a bit about what inspired you to create this visualization?
I'm so excited to be part of the Pride exhibit, and I can't wait to see other vizzes!
This viz combines my interest in human rights and my passion for learning something new.
I saw LGBT Human Rights Report by Saujanyae, and as a member of the LGBTQ+ community, I found the topic very interesting. I come from the Czech Republic, lived in Germany and Australia for some time, and wondered how much of a social bubble I've been living in so far. Looking at the data and my anecdotal experience, as a white ciswoman, I have been.
My second inspiration was a hex map by Toan Hoang from the blog Tableau Magic. I wanted to try to make one for some time, and this looked like a great opportunity.
While you were creating this visualization, what were some of the findings that struck you the most?
Probably how conservative lots of developed countries are. Even when the countries are somewhat tolerant, they're not explicitly supportive or protective towards LGBTQ+ people, especially transgender people. The most recent F&M Global Barometer of Transgender Rights report is from 2017, and it says only five countries are protecting transgender rights, and just 12 countries are tolerant. That leaves us with around 180 countries where transgender people can expect some kind of oppression. If we look at the Human Development Index, as we often tend to see developed countries as the advanced or "better" ones, 66 countries were listed as having very high development index value in 2019.
What do you hope that people take away from interacting with this visualization?
I hope they would look at the indexes I find more attractive to day-to-day life - press freedom, human freedom, gender gap, and happiness. An open-minded and accepting society is often happier. In countries where the system or people oppress each other, no one truly lives their best life.
One thing I love about your viz is that you were able to share and explain the different data sources you used. I'm curious how you found these data sources and if you have any tips for others who are looking to visualize diversity data and places they may be able to look?
Thank you! Sharing is caring, and being open about your sources is essential for me. This way, I can be called out if I misunderstand or misrepresent the data or inspire other people to do their own viz or analysis.
I look for the data sources either in other people's public visuals - be it Tableau Public, Data is Beautiful or data blogs. I also use Kaggle, Wikipedia - especially the References and External Links parts, and lots of web searching. If I may, I put together a list of open data sources on my blog.
Are there any other diversity-related visualizations you've seen on Tableau Public that have stood out to you over the last year? If so, which ones?
There are so many talented people out there! I loved the creativity of International Women's Day by Soha Elghany. Must Read Books By Black Authors by Adedamola Ladipo is nicely done; I enjoy the non-tech infographic style that's very popular now. And I love maps, so Income Inequality in Toronto by JR Copresos caught my eye.
Storie correlate

Meet Iron Viz 2024 Finalist Jessica Moon
 15 Aprile, 2024

Meet Iron Viz 2024 Finalist Pata Gogová
8 Aprile, 2024

Student to BI Analyst, How Tableau Can Lead to a Successful Data Career
 20 Marzo, 2024
Subscribe to our blog
Ricevi via e-mail gli aggiornamenti di Tableau.