DataFam Roundup: November 22 - 26, 2021


Dig into the latest DataFam Roundup—a weekly blog that brings together community content all in one post. As always, we invite you to send us your content—and the DataFam content from your peers that have inspired you! Find the content submission form here.
DataFam content

Ghafar Shah: Creating a Tableau business dashboard and learning some awesome viz tips
Dive into content created by the Tableau Community:
- Aasavari Kaley, Geek Culture: Building a Candlestick Chart — Storytelling with Data (Part III)
- Ankit Goyal: Dash-boarding Fundamentals — Prerequisites, Process & Designing Best Practices
- Ghafar Shah: Creating a Tableau business dashboard and learning some awesome viz tips
- Igor Garlowski: Edit tooltips directly from a dashboard
- Jim Dehner, VizConnect: Tableau Community Data Doctor Session November 2021
- Maryse Monen: How to create a bullet graph?
- Allen Hillery, Be Data Lit: Getting to Know 2021 Iron Viz Winner, Lisa Trescott!
- Eric Balash: BACK 2 VIZ BASICS
- Marc Reid: Tableau Data Visualisation Portfolio
- Neil Richards, Viz for Social Good: Tableau Conference 2021 Round-up
- Leslie Ong featuring Thi Ho: What data democratisation and John Lennon have in common
Upcoming User Group events and community participation
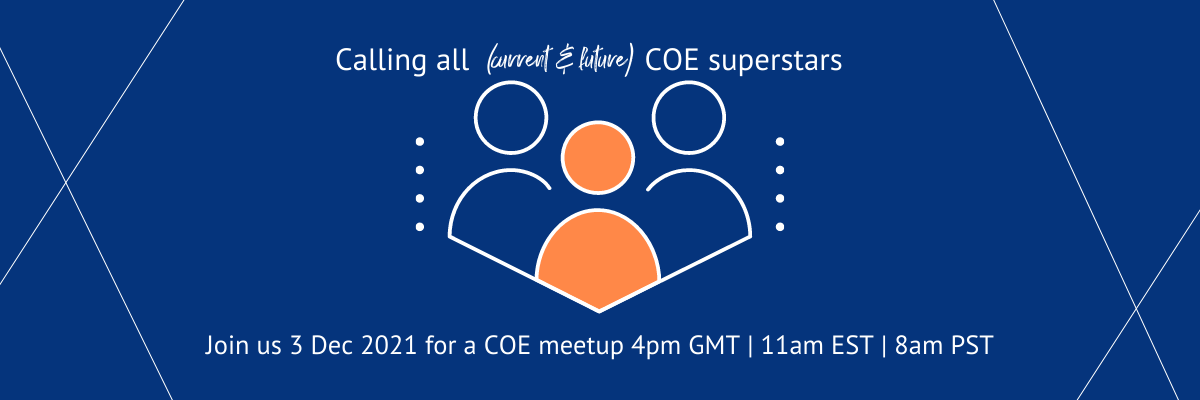
- Calling all (current and future) COE superstars! Join the December 3, 2021 COE Meetup. Register here.
- Participate in a Community End Of Year Card Exchange.
- Stay up to date with the latest and greatest from the Tableau Community. We'll help you along in your Tableau journey, bring your data skills to the next level, and nurture powerful connections.
- Final voting is now open for the 2021 Data Literacy Awards.
Vizzes
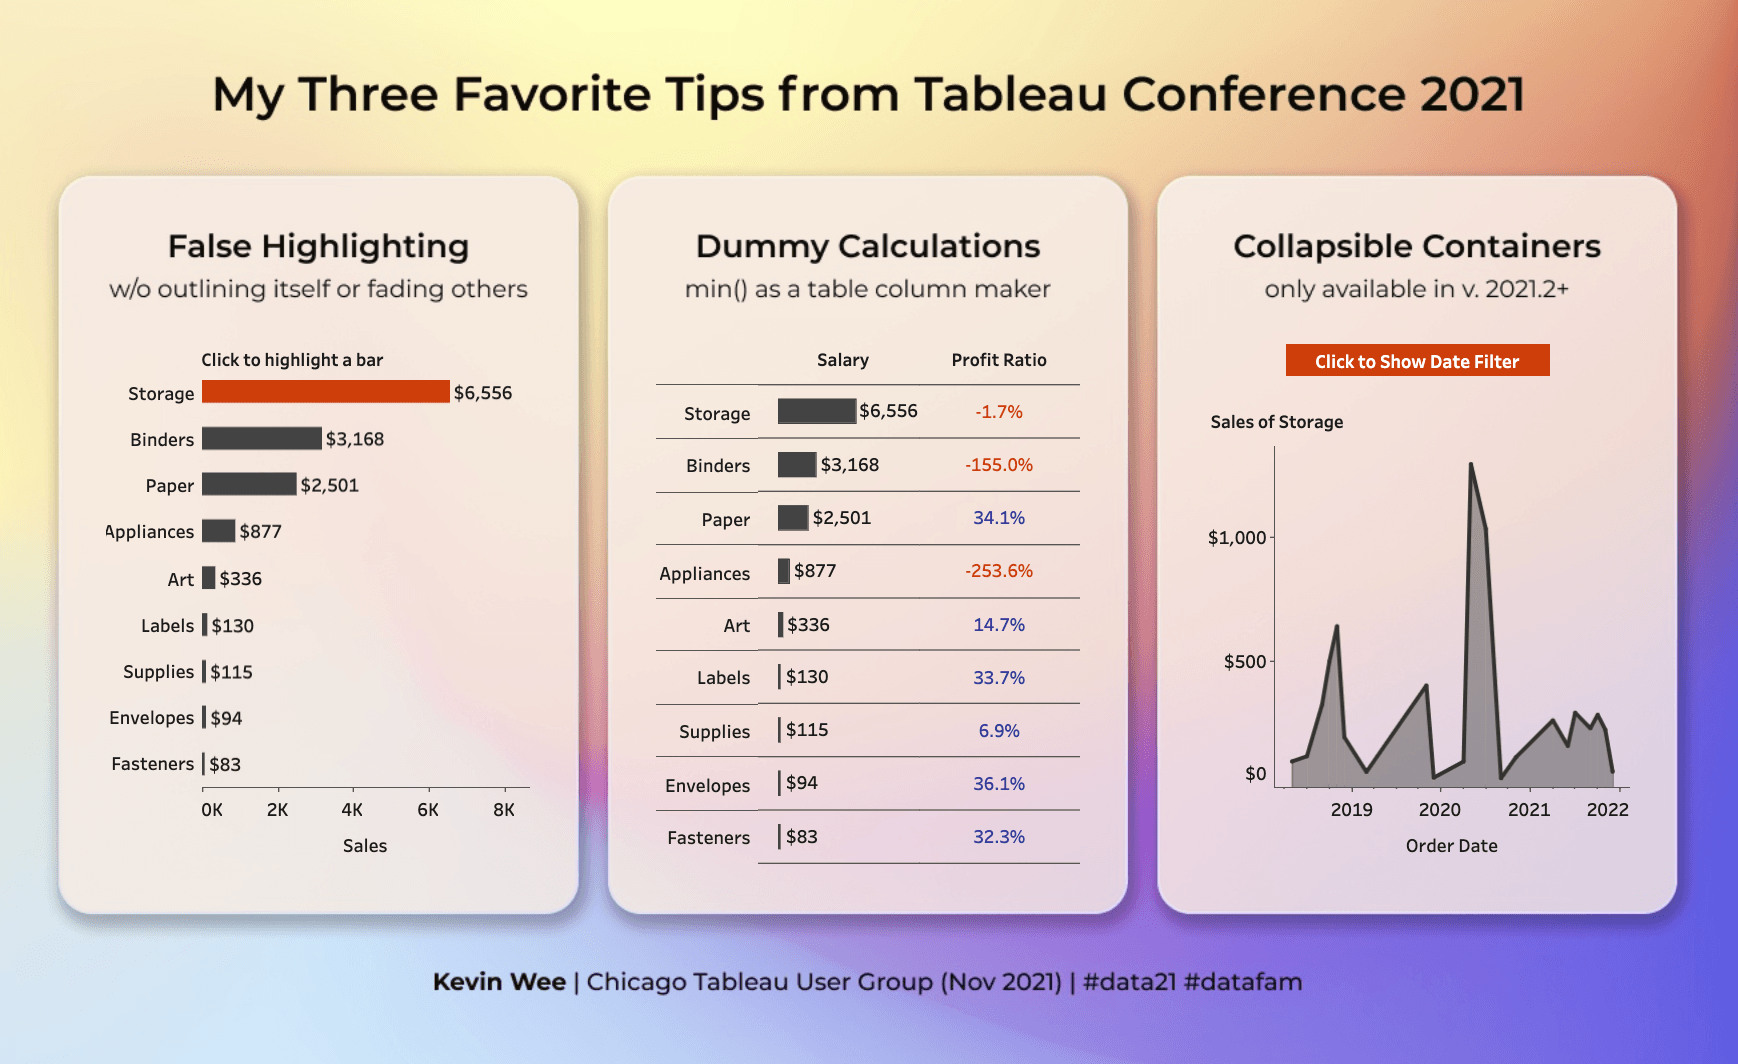
Kevin Wee 黃克文: My Three Favorite Tips from Tableau Conference 2021 #data21
Catch this week’s Viz of the Days here and subscribe to get them emailed directly to your inbox.
Check out some inspirational vizzes created by the community:
- Ryan Hart: HITTING THE MARATHON WALL
- Kevin Wee 黃克文: My Three Favorite Tips from Tableau Conference 2021 #data21
-
Fabio Fantoni: Superstore got Layers
Community Projects
Games Night Viz *NEW!
A monthly project focusing on using data from your favorite games.
Web: Games Nights Viz
Twitter: #GamesNightViz
November - December 2021: Level 1: Player Select
Workout Wednesday
Build your skills with a weekly challenge to re-create an interactive data visualization.
Web: Workout Wednesday
Twitter: #WOW2021
Week 47: The Thanksgiving NFL Games History
Preppin' Data
A weekly challenge to help you learn to prepare data and use Tableau Prep.
Web: Preppin’ Data
Twitter: #PreppinData
Week 41: Southend Stats
Iron Quest
Practice data sourcing, preparation, and visualization skills in a themed monthly challenge.
Web: Iron Quest
Twitter: #IronQuest
October 2021: Viz a Year or Decade
Storytelling with Data
Practice data visualization and storytelling skills by participating in monthly challenges and exercises.
Web: Storytelling with Data
Twitter: #SWDChallenge
November 2021: build a bullet graph
Project Health Viz
Uncover new stories by visualizing healthcare data sets provided each month.
Web: Project Health Viz
Twitter: #ProjectHealthViz
September 2021: Biggest Healthcare Data Breaches
Diversity in Data
An initiative centered around diversity, equity & awareness by visualizing provided datasets each month.
Web: Diversity in Data
Twitter: #DiversityinData
November - December 2021: The countdown to Christmas and New Year!
SDG Viz Project
Visualize data about Sustainable Development Goals provided by the World Health Organization.
Web: SDG Viz Project
Twitter: #TheSDGVizProject
Sports Viz Sunday
Create and share data visualizations using rich, sports-themed data sets in a monthly challenge.
Web: Sports Viz Sunday
Twitter: #SportsVizSunday
November 2021: Tableau Conference
Viz for Social Good
Volunteer to design data visualizations that help nonprofits harness the power of data for social change.
Web: Viz for Social Good
Twitter: #VizforSocialGood
Nov 28, 2021 - Jan 7, 2022: visualize our community
Real World Fake Data
Create business dashboards using provided data sets for various industries and departments.
Web: Real World Fake Data
Twitter: #RWFD
Viz 2 Educate
Each month, create vizzes on global education syllabus topics as resources for teachers worldwide.
Web: Viz 2 Educate
Twitter: #Viz2educate
Makeover Monday
Join the community every Monday to work with a given data set and create better, more effective visualizations.
Web: Makeover Monday
Twitter: #MakeoverMonday
Storie correlate

DataFam Roundup: April 8–12, 2024
 12 Aprile, 2024
DataFam Roundup: April 1–5, 2024
5 Aprile, 2024
DataFam Roundup: March 25–29, 2024
29 Marzo, 2024
Subscribe to our blog
Ricevi via e-mail gli aggiornamenti di Tableau.