Black History Month Celebrated: Week 3 Roundup


The third week of Black History Month comes to an end, but #VisualizeDiversity continues! The submission window for #VizforSocialGood will remain open until Thursday, March 15th. Chloe Tseng challenged participants to create a dialogue around women in politics by leveraging data visualization. Here are some examples of Tableau Public authors doing just that.
- Bart Popęda: Women of colors in US Congress
- Pamela Germain: Black History Month 2018 Week 3 - U.S. Congress
- Yoshihito Kimura: Black History Month W3 "Women in Politics" viz for social good
- Chloe Tseng: #VizforSocialGood: VOTE: Women
- Marcela Janowska: Uganda Woman Voice - Viz for Social Good | Vizualise Diversity
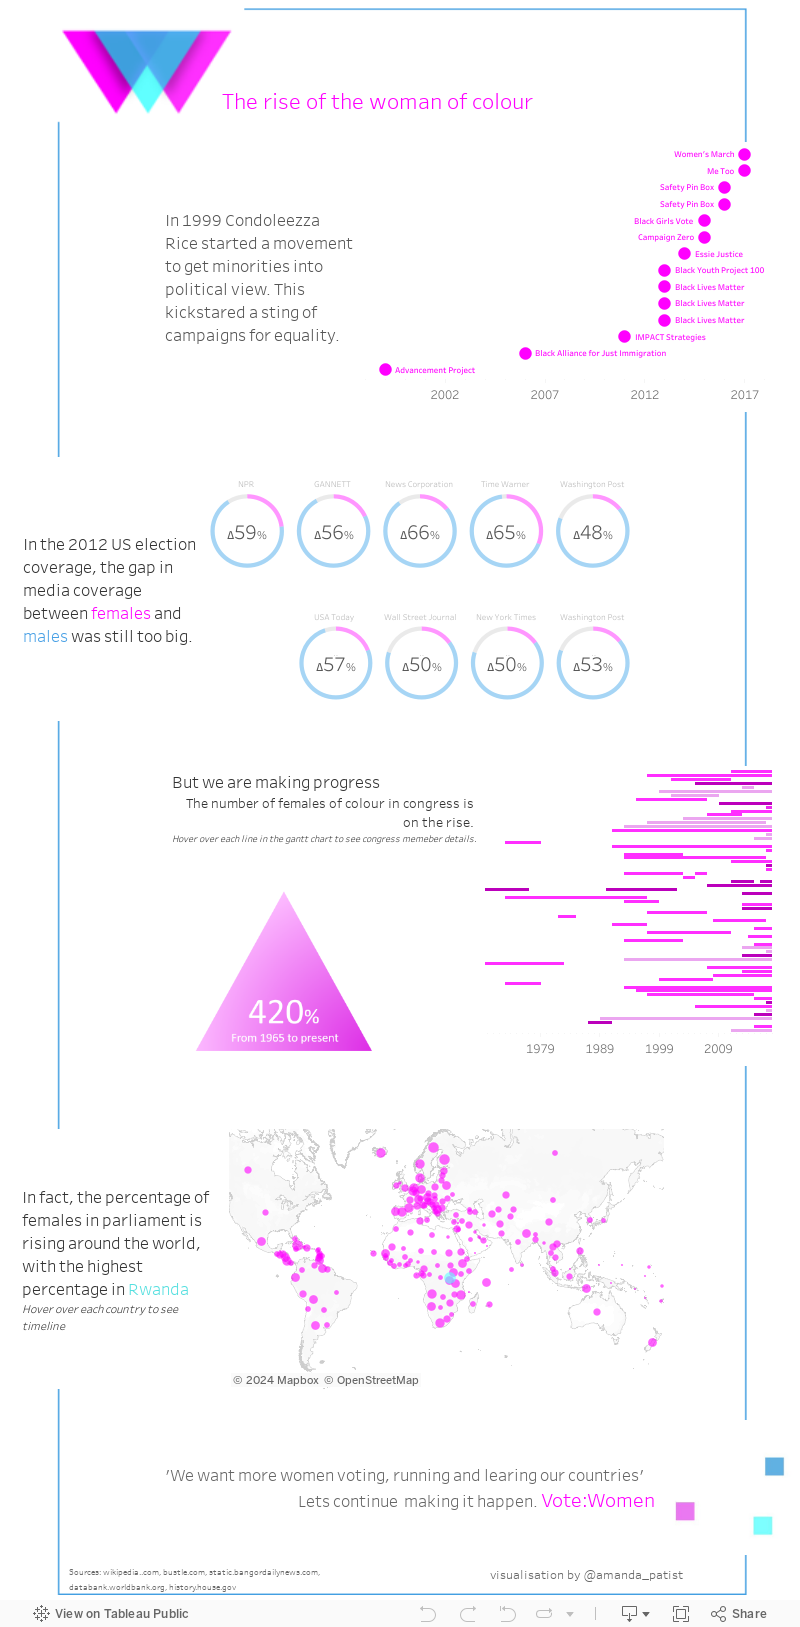
The rise of the woman of colour by Amanda Patist
The fourth and final theme for #VisualizeDiversity is Civic Engagement & Politics. Below are a couple data sets that might help you get started, but this data only scratches the surface of civic engagement and politics. Have a different data set in mind? Add to the discussion tab on data.world.
- U.S. Naturalizations sourced from U.S. Department of Homeland Security
- Notable U.S. Immigrants sourced from Wikipedia
We encourage anyone to participate and help us inform, highlight and celebrate Black History Month.
Storie correlate

Meet Iron Viz 2024 Finalist Jessica Moon
 15 Aprile, 2024

Meet Iron Viz 2024 Finalist Pata Gogová
8 Aprile, 2024

Student to BI Analyst, How Tableau Can Lead to a Successful Data Career
 20 Marzo, 2024
Subscribe to our blog
Ricevi via e-mail gli aggiornamenti di Tableau.