
10 Best Practices for Building Effective Dashboards
Learn how to make your dashboards more informative, compelling, and effective
Download this free whitepaper
When a dashboard is done right, people wonder how they ever lived without it. Why? A well-designed dashboard is a launch point for insights into all of your systems. Armed with data from your ticketing, budgeting or monitoring systems, your IT organization can make faster decisions based on a single source of truth.
Read this whitepaper to discover how:
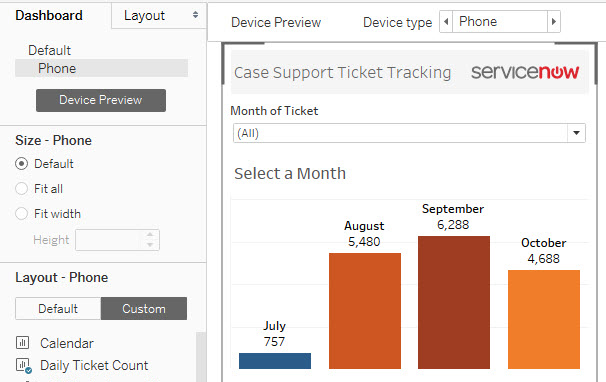
- Thoughtful planning will allow you to become familiar with your dashboard audience, evaluate proper display size, and appropriately plan for fast load times.
- Informed design draws from the “sweet spot” of visual cues, is critical of view and color quantity, incorporates interactivity to encourage exploration, and considers progressive formatting.
- Refining your dashboard puts the onus on tooltips, emphasizes the story within your story, eliminates clutter, and sets you up for dashboard testing opportunities.
Tableau è uno dei migliori strumenti sul mercato per creare visualizzazioni estremamente efficaci e ricche di informazioni. Lo utilizziamo per analisi che richiedono ottime visualizzazioni dei dati affinché ci aiuti a raccontare le storie che stiamo cercando di comunicare alla nostra direzione aziendale.