What you need to know about COVID-19 data and rural America
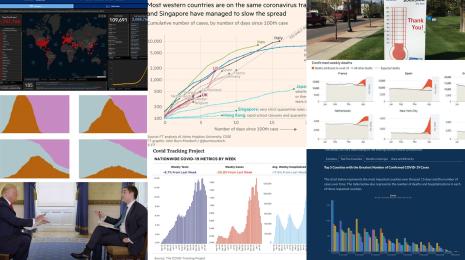
In many ways, the story of COVID-19 that’s dominating our understanding of the virus is an urban story. Look at The New York Times map of the case data across the U.S., and you see an enormous red circle around the New York metropolitan area, blotting out the counts in smaller towns and cities. Cities, of course, have larger and denser populations than more rural regions, and the number of cases reported out of urban areas are correspondingly higher.
But to really understand how COVID-19 is playing out across the U.S., we need to take a closer look at rural America. We have to understand how different demographics and industries are shaping the way the virus is spreading, and we have to understand what the data we have is telling us about the virus—and what we’re not seeing reflected in the numbers.
To understand the differences between the way COVID-19 is playing out in rural communities—and how demographics, data collection, and reporting are impacting our understanding of the data—I talked with Bryn Bird MPH, a public health professional with a concentration in epidemiology and rural health policy advocate based in Granville Township, Ohio, where she also serves as a local elected trustee.
As the COVID-19 outbreak has progressed, Bird has been analyzing how data on the virus is shaping federal and local responses, and how that data is or is not capturing the reality her constituents and others in rural America are facing. Here are the biggest takeaways from our conversation, which you can watch in full here:
Data collection on COVID-19 is not standardized—so it’s hard to get an accurate picture of the outbreak
The most important thing to know when looking at case data across the United States is that the numbers are not a direct translation of reality. In other words, there’s an element of human decision-making and capacity that factors into what gets reported and reflected in the data, Bird says. Daily case counts represent the day a case was confirmed as a positive - not the day the swab was taken, which is often three to seven days prior. Death reports depend on having a form filled out, submitted, and summarized in a central database. Functionally, means COVID-19 case data—unlike data on the flu, which is incredibly standardized in how cases are reported—varies across counties and states.
Up until recently in Bird’s home state of Ohio, a case of COVID-19 had to be laboratory confirmed with a positive test to be counted. Last week, Ohio started including probable cases in their tally. The state continues to display data on confirmed cases to show the difference between the two counts—on one day, there was a gulf of 91 cases between the confirmed count and the confirmed-plus-probable tally—and to ensure their data can still be compared with other states’ like neighboring Kentucky, which only counts confirmed cases.
Looking at recovery data is similarly complicated, Bird says. “The way that Ohio is showing recoveries is by saying that if two weeks go by and a person doesn’t end up in the ICU or they’re no longer hospitalized, they’re recovered.” Tests are so scarce that getting a laboratory-confirmed negative test is very difficult, but places like Pennsylvania still require a negative test to declare someone recovered. Different definitions of “recovered” make it hard to compare across states or create an accurate aggregate picture at a national level.
Our visualizations of COVID-19 case data may be masking outbreaks in rural America
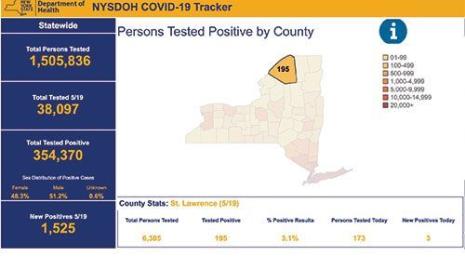
“If we keep looking at case numbers, versus looking at the numbers in context of the population, that's a huge problem,” Bird says. What we’re seeing in the conversations around COVID-19 is a focus on where the largest case tallies—regardless of how they are counted—are clustered. But in rural counties with smaller populations, even a dozen or so cases can signal a major problem, Bird says. There isn’t a one-size-fits-all analysis solution; we need to look at both total case counts and data normalized to population as we make sense of this pandemic. In either case though, the numbers remain uncertain and incomplete.
To understand outbreaks in rural America, we need to shift our understanding of it
“There’s an assumption that rural communities are white and old,” Bird says, and that the main industry is farming and agriculture, which makes preventative measures like social distancing possible. But in reality, rural America has enormous immigrant and refugee populations, and many people from those communities work in industries like industrial agriculture and meatpacking.
Because these industries are deemed essential and the workers are particularly vulnerable, they are quickly becoming some of the most concerning epicenters of COVID-19’s spread. “We’ve seen the outbreak at the Smithfield plant in Sioux Falls, South Dakota where there were 640 cases from that single plant, and outbreaks are starting in places like North Carolina, where there are enormous chicken farms that employ very vulnerable populations,” Bird says.
By understanding the demographics of rural America and where these hotspots are occurring, we can use data to try to get out in front of them, Bird says. “We need to look at population demographics and identify where these big manufacturing and industrial agriculture institutions are so we can uncover where the next hotspots might be,” she says.
Diversity in data analytics matters
As experts and policymakers analyze data coming out of rural communities on COVID-19, it’s absolutely essential, Bird says, that people familiar with the nuances of these communities are in the room advising on the situation. The National Rural Health Association, Bird says, is working hard to ensure that responses to the pandemic take into account the differences in rural communities across the United States, from demographics to major industries and employers to the availability of healthcare and other critical resources.
All of those elements need to be taken into account when analyzing the data and developing solutions, but they might be missed by people not familiar with the context, Bird says. “I would say if you look around the room at who you're running data with, and you all look the exact same and live in the same place and have had kind of the same life experiences, you're probably missing some gaps in what the data is really saying,” she says.
Through Tableau’s COVID-19 Data Resource Hub, we’re bringing together expert perspectives on data and COVID-19. Learn more here.
Storie correlate
Subscribe to our blog
Ricevi via e-mail gli aggiornamenti di Tableau.


