Honey, where’s my citrus fruit? 13-year-old Cedric dives into the data to find out


Do you remember your first science fair project in elementary school? I definitely remember mine! For every state we travelled to one summer, I collected dirt and jotted down notes every time the dirt changed in color or texture—but the analysis ended there.
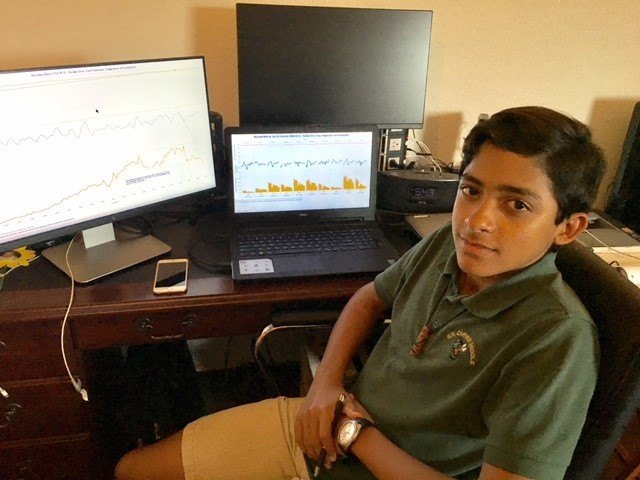
13-year-old Cedric had a different story, taking his science fair project to the next level with Tableau, analyzing if the changing climate affected citrus production in his home state of Florida. I sat down with the analytics superstar—and his dad—to learn more about what inspired him to dig into the data.
The adventure begins
So, how did Cedric come to this brilliant idea? Cedric’s dad, Tom Gomez, is a Tableau enthusiast who has used Tableau for over 5 years, teaching Cedric key fundamentals along the way. When it came to Cedric creating his own data project, Tom suggested analyzing it in Tableau. Cedric was on board with the idea. Since he didn’t have a Tableau license, he worked with Tableau’s academic team through the Tableau for Students program.
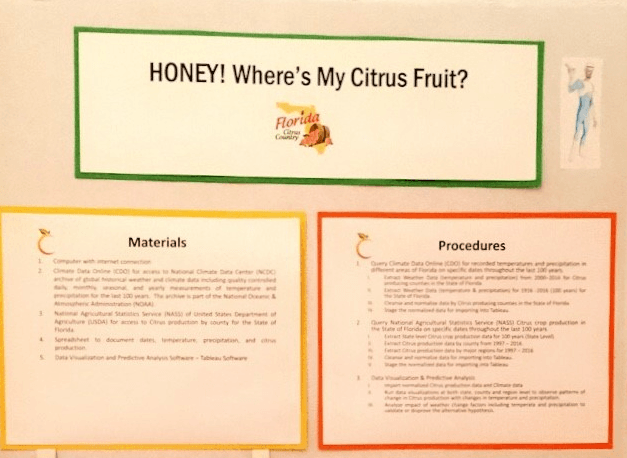
To get started, Cedric manually extracted government data and exported it into Excel files. He ended up having over 900 extracts (what a trooper!). Instead of digging through 900 extracts, he cleaned and normalized the data so he could use Tableau to analyze the data.
Digging into the data
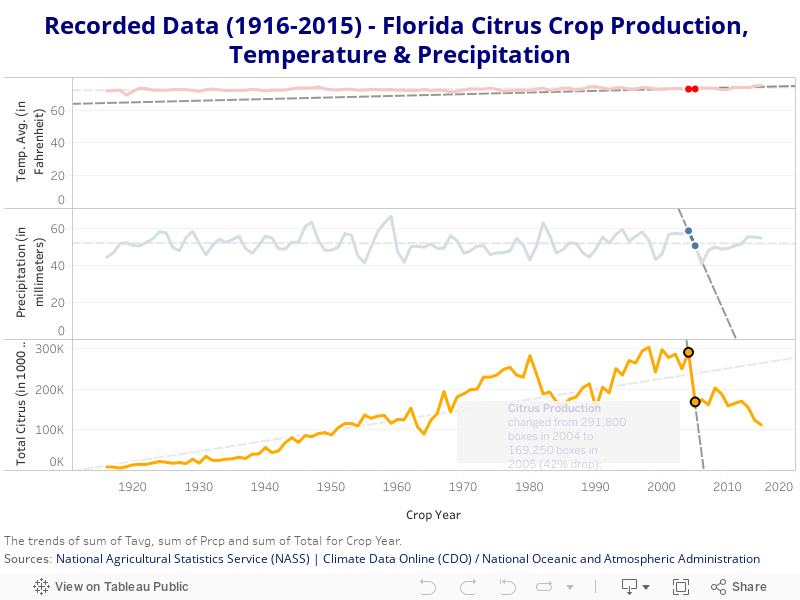
Cedric framed his analysis with a question: “How has the changing climate affected citrus production in the state of Florida?” He had a few hypotheses:
- Alternative: If temperature and precipitation are changing, then citrus production in the State of Florida will decrease.
- Null: If temperature and precipitation are changing, then citrus production in the State of Florida will neither increase nor decrease.
Cedric caught onto the software quickly, driving the bulk of the analysis. He said, “It was really easy to use and navigate!” His dad would coach him and encourage him to look for patterns and outliers.
After playing with the data, he noticed that there was a big drop in citrus production from 2004 to 2005 (see viz below). Being the data rockstar that he is, he asked “what happened?” Cedric dug into the data and did a little research on the side and discovered that it was caused by a disease called “Citrus Greening,” which affects the respiratory system of the plant.
Cedric said, “It wasn’t what I was expecting but that’s what makes data storytelling fun.” I couldn’t agree more. I loved exploring his data story through his viz. Check it out for yourself!
Honey! Where’s my citrus fruit?
He put together all of his vizzes and materials and headed off to the science fair—where he ended up in the first place category with several other talented kids. Cedric’s project especially stood out as the only one related to data science.
Not only is Cedric a data rockstar, but he also has an awesome sense of humor—just look at the title of his science fair project. For those who don’t get the reference, we will give you a hint.
I was so impressed with Cedric’s work that I had to ask again, “How involved was your dad?” His dad promptly jumped in and confirmed Cedric drove all the movements and that Cedric even taught him a thing or two.
Very curious, I asked him what he taught his dad and without hesitation he said, “I found faster shortcuts and I was better at identifying features. Also, I showed him trend lines and we learned how to use them together!”
What’s next for Cedric?
Being placed in the first place category was just the beginning for Cedric! He has a full schedule put together for his summer break where he plans to take advanced Tableau training classes and to get involved in other industry classes. In addition, he wants to get teachers involved and encourage students to pursue data science projects—since he hasn’t seen that at the middle school level. Cedric definitely understands we live in a data-driven world!
But that’s not all! His next data visualization project is to analyze a dataset with a billion rows of data. Can you believe that? I can hardly wait to see what Cedric does next—stay tuned to his Tableau Public profile to see what he’s up to.
Meet more #datakids
Maggie is a 9-year-old data rockstar with a penchant for animated film
Meet Joe, the 8-year-old Tableau viz whiz
This data kid's favorite Pokémon? He found the answer in the data
How this young Trekkie is finding stories in his data
How visualizing data helped one boy ‘see the connections’
How one boy uses data to build his Grossery Gang collection
Data kids and parents, we invite you to join our Data Kids community group! Please sign up here to request access.
Storie correlate
DataFam Roundup: April 15–19, 2024
 19 Aprile, 2024

Meet Iron Viz 2024 Finalist Jessica Moon
 15 Aprile, 2024

DataFam Roundup: April 8–12, 2024
12 Aprile, 2024
Subscribe to our blog
Ricevi via e-mail gli aggiornamenti di Tableau.