What This Zen Master Learned from Creating Games in Tableau


I use Tableau every day at work to analyze business data, ask and answer questions, and help uncover insights that drive key decisions. In the off hours, I love to push the limits with Tableau, and I’ve discovered that the platform actually makes for a pretty decent game engine—no, really! I’ve made Tic Tac Toe, Choose Your Own Adventure, Blackjack, and, coming soon, Star Trek all using only Tableau!

When I recently mentioned that I enjoyed making games in Tableau, the response I got was, “Can I ask what the fascination is for trying to use Tableau this way? It's a bit like trying to build a crane to prove that you can use a lawn mower to prune a tree.”
Personally, I don’t see anything wrong with using a lawn mower in that fashion!
And maybe that’s why I don’t see anything wrong with using Tableau as a game engine. I’ll readily admit, the platform wasn't designed to build games; it's designed to visualize data, and even more specifically to explore, analyze, and tell stories with data.
So why do I build games in Tableau? Let me tell you, and along the way share with you a few practical Tableau tips and tricks.
A Game Is a Data Story
In a sense, a game is a story told with data. It's a highly interactive story in which you are the main character. Everything in the game is data: the location of the pieces on the board, the score, the order of the cards in the deck. And Tableau gives us a way to visualize that data.
Games are extremely challenging to tell as data stories. They are highly dynamic; they evolve as they are played. The data is constantly changing through interactions. Pieces move, scores go up and down, and the deck gets shuffled. Tableau does an outstanding job visualizing the data that exists, but it’s a challenge to alter the data.
There are other challenges for designing games in Tableau. How can dashboards change dynamically to reflect different game conditions? How can actions or parameters be used to allow a seamless interface?
But the challenges are fun and exciting. They allow me to push the limits of Tableau. It's an amazing platform that’s extremely flexible yet highly structured. It allows for complex logic yet is easy to use. What other platform do you know of that allows someone to sit down for the very first time and build insightful visualizations within minutes, but also allows someone to build an AI that wins every game of Tic Tac Toe?
And as I push the limits of Tableau, I stretch myself. I’m challenged to come up with new approaches. I gain new insight into the workings of Tableau. I learn how to tell more compelling and engaging stories. And the lessons all becomes practical when I return to my day job of training, mentoring, and working with clients to build insightful visualizations and dashboards.
Finding Inspiration & Getting Started
How does one start building games in Tableau? First, I look for inspiration. It might be a game that someone else has created (such as this Treasure Map by Matt Francis) or a thought triggered by another Tableau user (such as Noah Salvaterra’s warnings of a self-aware Tableau, which prompted me to teach a self-aware machine to play Tic Tac Toe), or a game or activity I remember from childhood.
Once I have an idea, there are several steps I take to build out the game:
- Create the Data: Unlike most Tableau visualizations and dashboards, which explore an existing data set, most games require customized data. It might be simple (52 records for the deck of cards in Blackjack) or complex (millions of records for each possible move in Tic Tac Toe). I often find myself adjusting the data set as needed to accommodate the design.
- Design the Dashboard: I usually have an idea for a layout, though it goes through several iterations as I experiment with what works and what doesn’t.
- Determine the Interaction: Often this step works in conjunction with the design. But sometimes I don’t know exactly what will work from a technical perspective until I have designed the initial dashboard. At first, I thought I’d let the user interact with Blackjack using action filters, but soon realized I needed to use parameters to keep all the data in the view.
- Build and Test Iteratively: I’ll usually build out an initial version of the game, test it, and then iteratively improve it.
Dynamic Dashboards Are Key
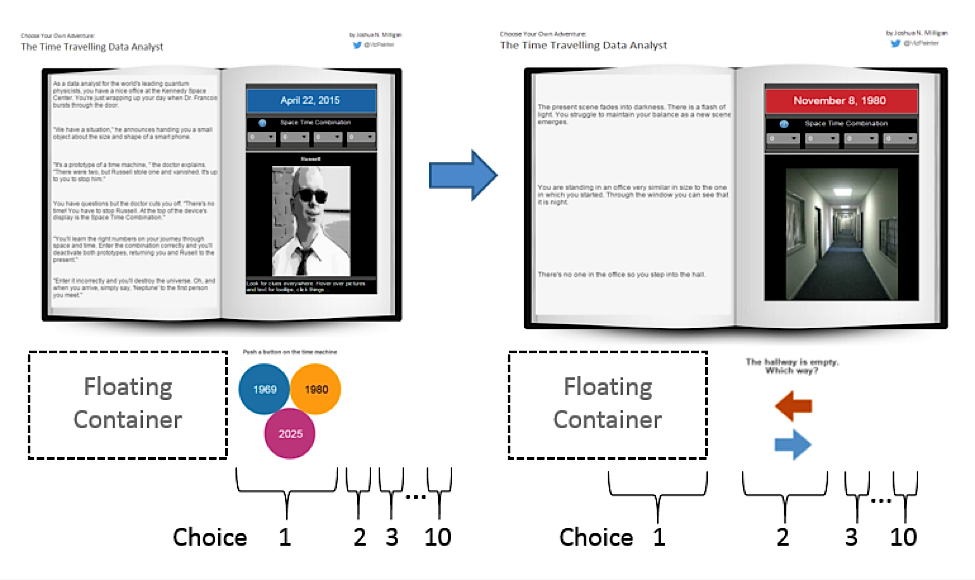
Nearly every game requires highly interactive and dynamic dashboards. Take the Choose Your Own Adventure game as an example. Each choice is a separate view. Making a choice by clicking on a circle, arrow, or text in that view initiates a series of actions that updates the entire dashboard and reveals a new choice.
It works by expanding upon the sheet selection technique outlined in this knowledge base article. The basic idea is that any view on a dashboard will collapse when the view’s title is not shown and all the data is filtered out. The view will expand again once filters change and there is data to show.
When you first start the game, Choice 1 is visible. All other choices are collapsed. When you click a circle in Choice 1, it updates the entire dashboard and also causes Choice 2 to expand.
The challenge is that an action can’t directly change the source sheet. So how do you hide Choice 1 when Choice 1 initiated the action? My solution was to strategically place a floating container on the dashboard so that the expansion of Choice 2 would push Choice 1 under the container, effectively hiding it. Choices 3, 4, and so on would do the same thing.
Outside of games, these techniques can be quite practical. Let’s say I have a simple dashboard with which I want to show profit over time and additionally allow my audience to highlight specific periods of interest using a parameter.
The parameter is a simple list that includes items such as This Year, Previous Year, and also Custom, which would allow the user to specify a start and an end period. But I don’t want to show options for Start and End unless the user has selected Custom.
Here it is in action:

Here’s how it works:
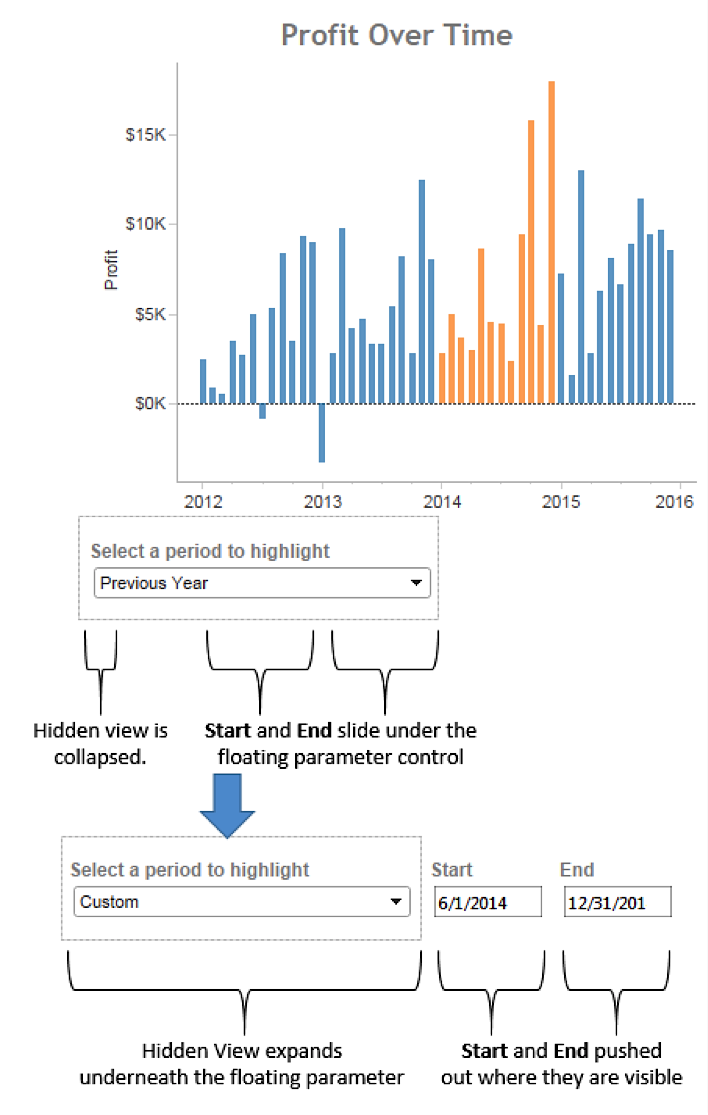
The Select a Period to Highlight parameter floats over the Start and End parameters. Additionally, the Select a Period to Highlight parameter floats over another hidden view. This hidden view is always filtered and collapsed until the user selects Custom. At that point, the hidden view expands and pushes the Start and End parameters out from under the floating parameter to where they are visible.
Telling Engaging Stories
Telling the story of a game with the player as the main character has helped me think about ways to better tell data stories to business users and executives. Now, when I design a dashboard, I look for ways to engage my audience and draw them into the data story.
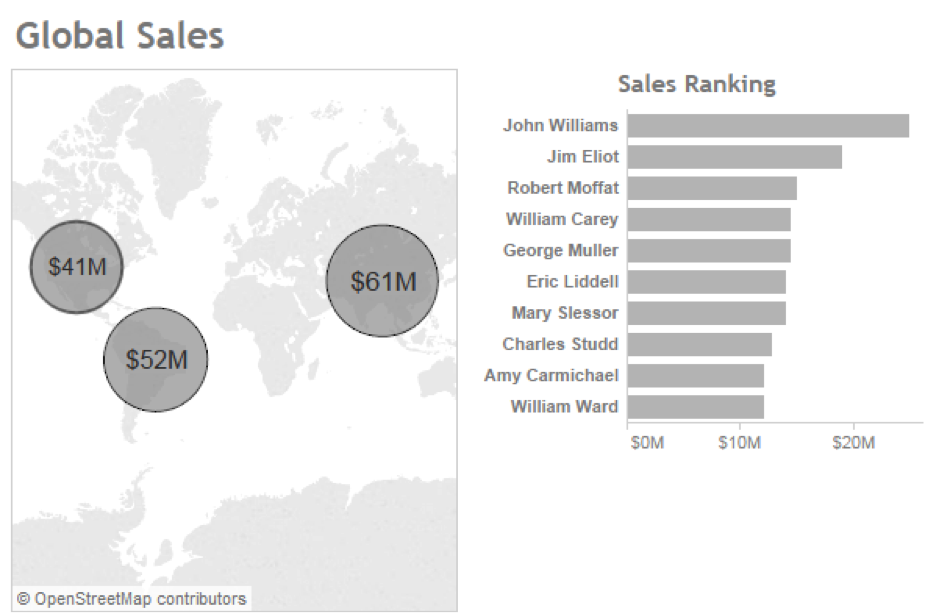
Compare the following to options for a dashboard designed for salespeople. In the first case, I give them a fairly decent view of regions and sales leaders. They can find their name in the list:
But what if, instead, I ask them who they are and then make some very slight changes:
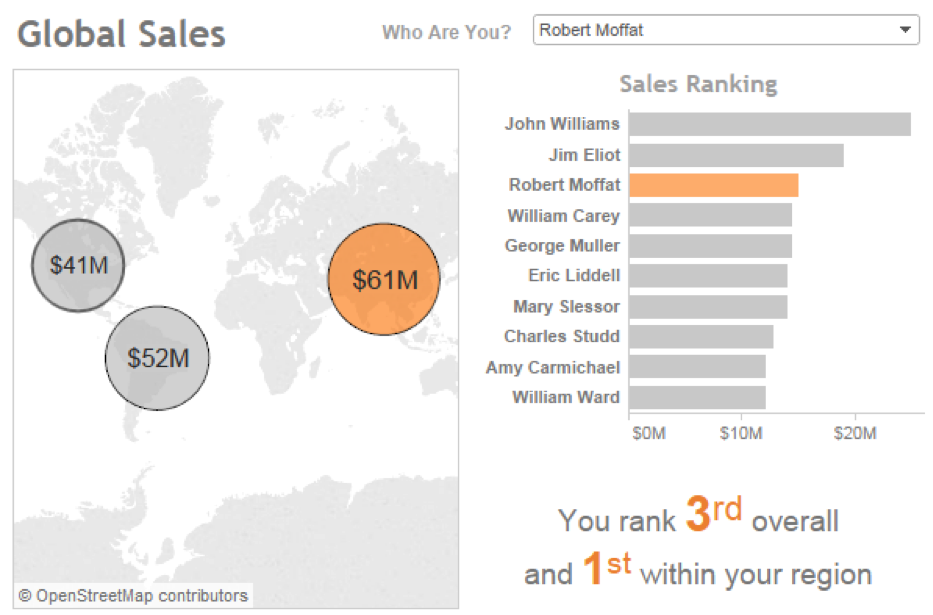
If the data allowed for it, I could even use the USERNAME() function to figure out their identity automatically. Either way, I’ve shown my audience their place at the center of the story. I’ve taken an ordinary dashboard and turned it into a game.
Pushing the Limits
We play games from the time we are young as a way of learning and challenging ourselves to grow. Building complex dashboards and logic to build games using the Tableau platform helps me learn. And in learning to craft the story of a game, I’ve learned to better tell the story of their data.
Check out additional works by Joshua Milligan on Tableau Public, on Twitter, and on his website, vizpainter.com.
Subscribe to our blog
Ricevi via e-mail gli aggiornamenti di Tableau.