Data-driven retail


Retailers are bursting at the seams with data. From what customers load into their carts (tangible or online) to inventory filling a warehouse, there’s no end to the data available to maximize customer satisfaction – and sales. So how are leading retailers using data to their advantage? A growing answer is this: make sure everyone in the organization can do their own data discovery with self-service business intelligence.
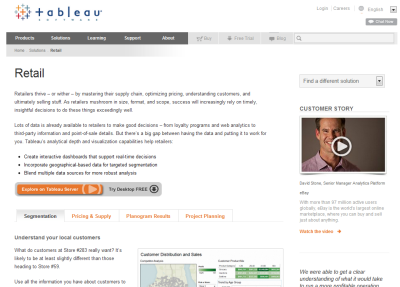
Two examples of retailers using Tableau to get more from their data include Barnes & Noble and eBay.
At Barnes & Noble, Marc Parrish, Vice President of Loyalty & Retention, has turned the use of analytics on its head. In a recent webinar, Marc gave an in-depth look at how he helped Barnes & Noble reduce analysis time from weeks to hours, not to mention monitor every product line in its 2,000+ stores – in real-time using Tableau.
David Stone, Senior Manager Analytics Platform at eBay, spoke last year at our customer conference. He described at length the importance of offering analytics tools to the eBay team. Why was it so important? Because they collect more than 5 TB of data every day and the insight they need to run the business is buried in that data. Now eBay wasn’t limited to looking at data for, say the top 3-4 items in a category – they could dig deep into the top 40,000 since they no longer faced row limits and could do the data discovery on their own.
The ways retailers can use data for insight is limitless. We describe four possibilities on our Retail solution page that will give you a window into some options. Check them out! You’ll see how analyzing neighborhood data can point you in the right direction for your product mix. A planogram gives quick insight into how departments perform. Click into the Pricing & Supply tab and adjust the price to see what the impact would be. Project Planning – critical to managing human assets effectively – is another example of how Retailers are finding ways to get fast, meaningful insight into their data.
Subscribe to our blog
Ricevi via e-mail gli aggiornamenti di Tableau.