In the world of big data, data visualization tools and technologies are essential to analyze massive amounts of information and make data-driven decisions. Our culture is visual, including everything from art and advertisements to TV and movies, and our eyes are drawn to colors and patterns. Our interaction with data should reflect this reality.
Make your data better
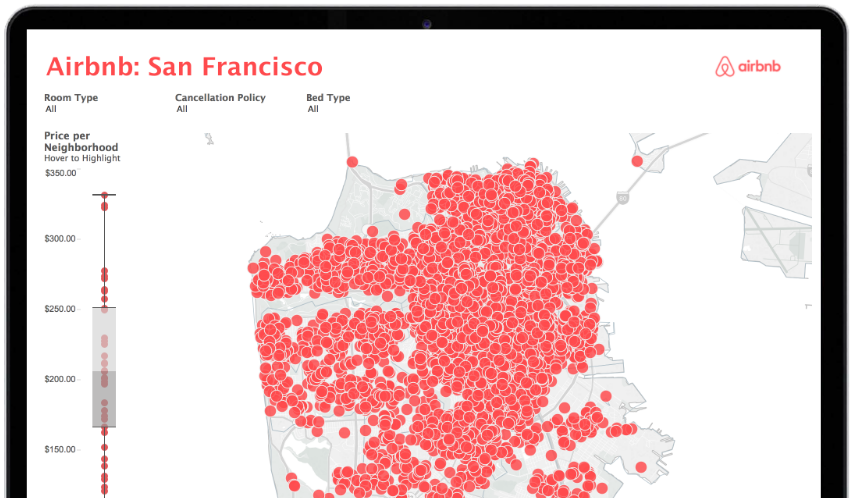
This visualization shows San Francisco Airbnb listing data on a map. Because all of the listings are the same size and color, even with filters, it’s hard to differentiate the value between the listings at a glance.
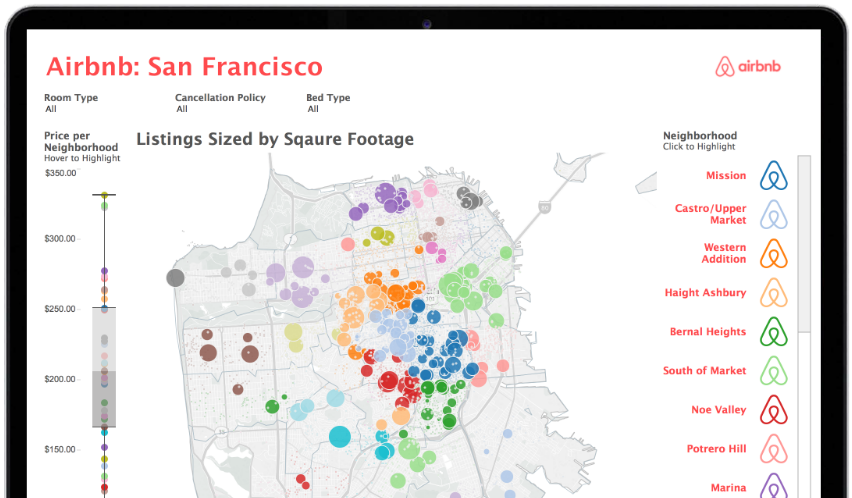
Take your viz from good to great with just a few tweaks.
Full-version trial. No credit card required.
THE TRIAL CANNOT BE INSTALLED ON MOBILE DEVICES

Explore your data with a purpose
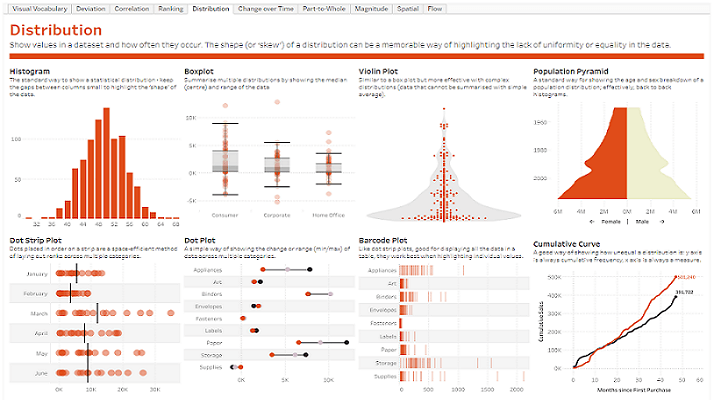
Data visualization is a form of visual art that grabs our interest and keeps our eyes on the message. When we see a chart, we quickly see trends and outliers.
If we can see something, we internalize it quickly. If you’ve ever stared at a massive spreadsheet of data and couldn’t see a trend, you know how much more effective a visualization can be.
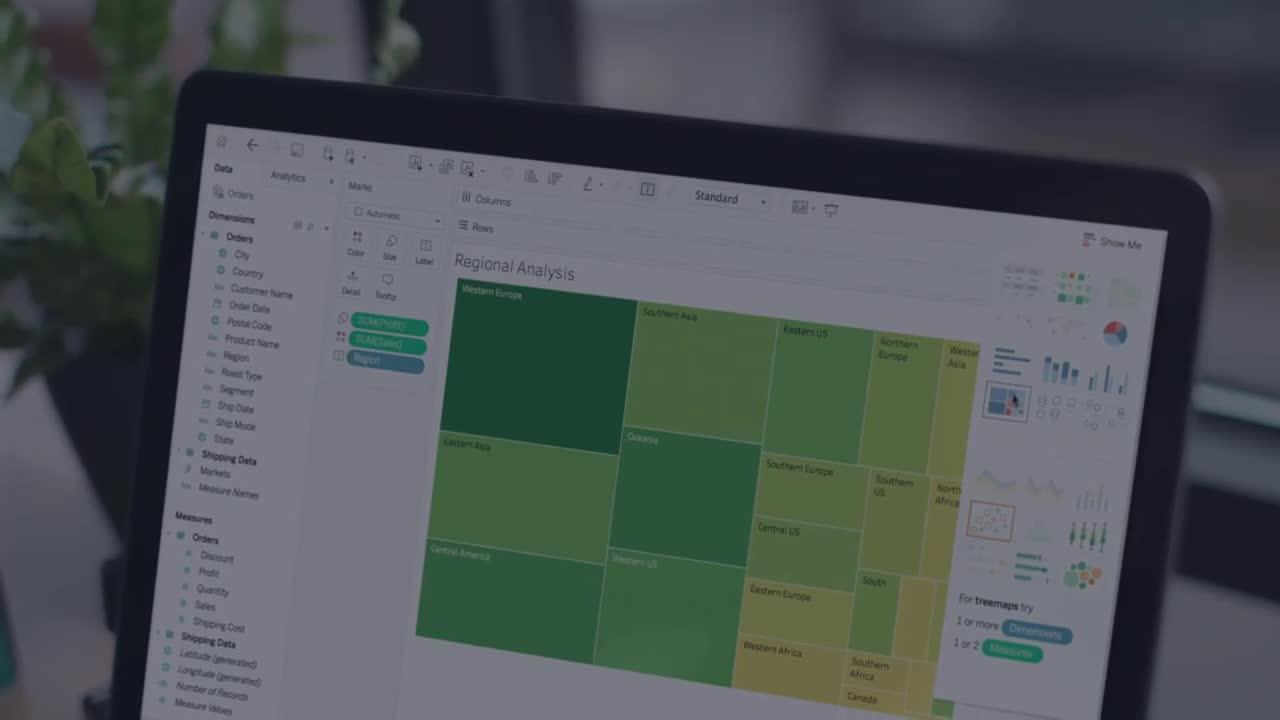
Tableau is one of the best tools out there for creating really powerful and insightful visuals. We’re using it for analytics that require great data visuals to help us tell the stories we’re trying to tell to our executive management team.

Visualize your data in Tableau
Fast Analytics
Connect and visualize your data in minutes. Tableau is 10 to 100x faster than existing solutions.
Ease of Use
Anyone can analyze data with intuitive drag & drop products. No programming, just insight.
Big Data, Any Data
From spreadsheets to databases to Haadoop to cloud services, explore any data.
Smart Dashboards
Combine multiple views of data to get richer insight. Best practices of data visualization are baked right in.
Update Automatically
Get the freshest data with a live connection to your data or get automatic updates on a schedule you define.
Share in Seconds
Publish a dashboard with a few clicks to share it live on the web and on mobile
devices.
Cité dans