Released August 2016
See all of Tableau 10.0's features in detail here.
Your data, only hotter.
Tableau 10 brings you an entirely new look and feel, with beautiful viz formatting defaults and updated typography to make your data smoking hot. But don’t let the pretty face fool you—Tableau 10 is much more than skin deep.
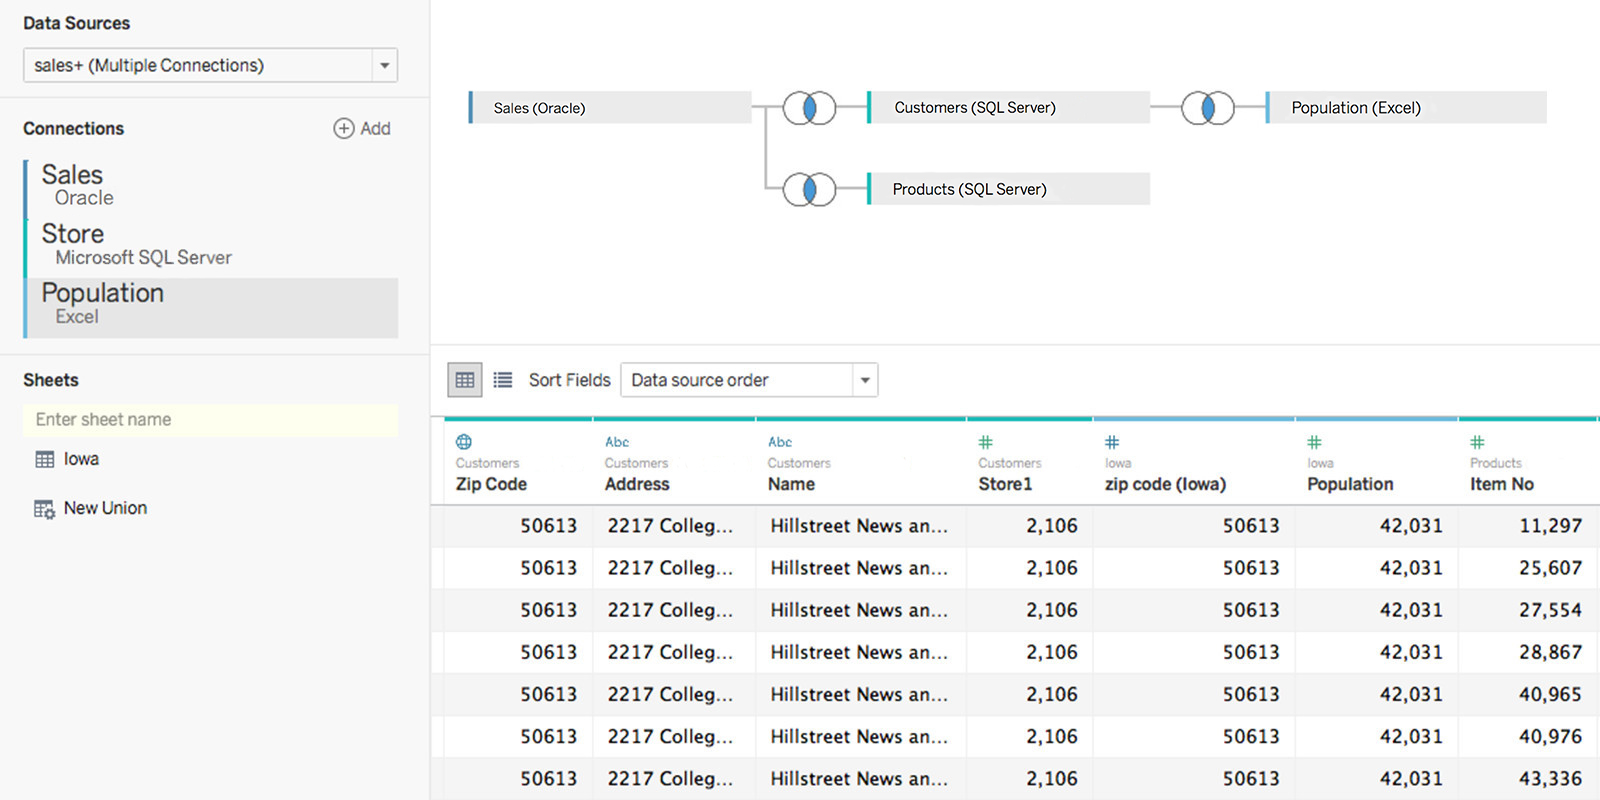
Create and share an entirely new data source from multiple, disparate data sources—like SQL Server and Amazon Redshift—with cross-database joins. Ask deeper questions of your data, thanks to drag-and-drop clustering and custom territories. And create a single dashboard optimized for any mobile device with device designer.
With dashboard authoring on the web and revision history at the ready, it’s easier for everyone to use Tableau when and where they want. Plus, we've got powerful governance and extensibility features for scalable enterprise deployments. Enjoy speedier load times, instant updates based on your interactions, and more.
Answers through Analytics
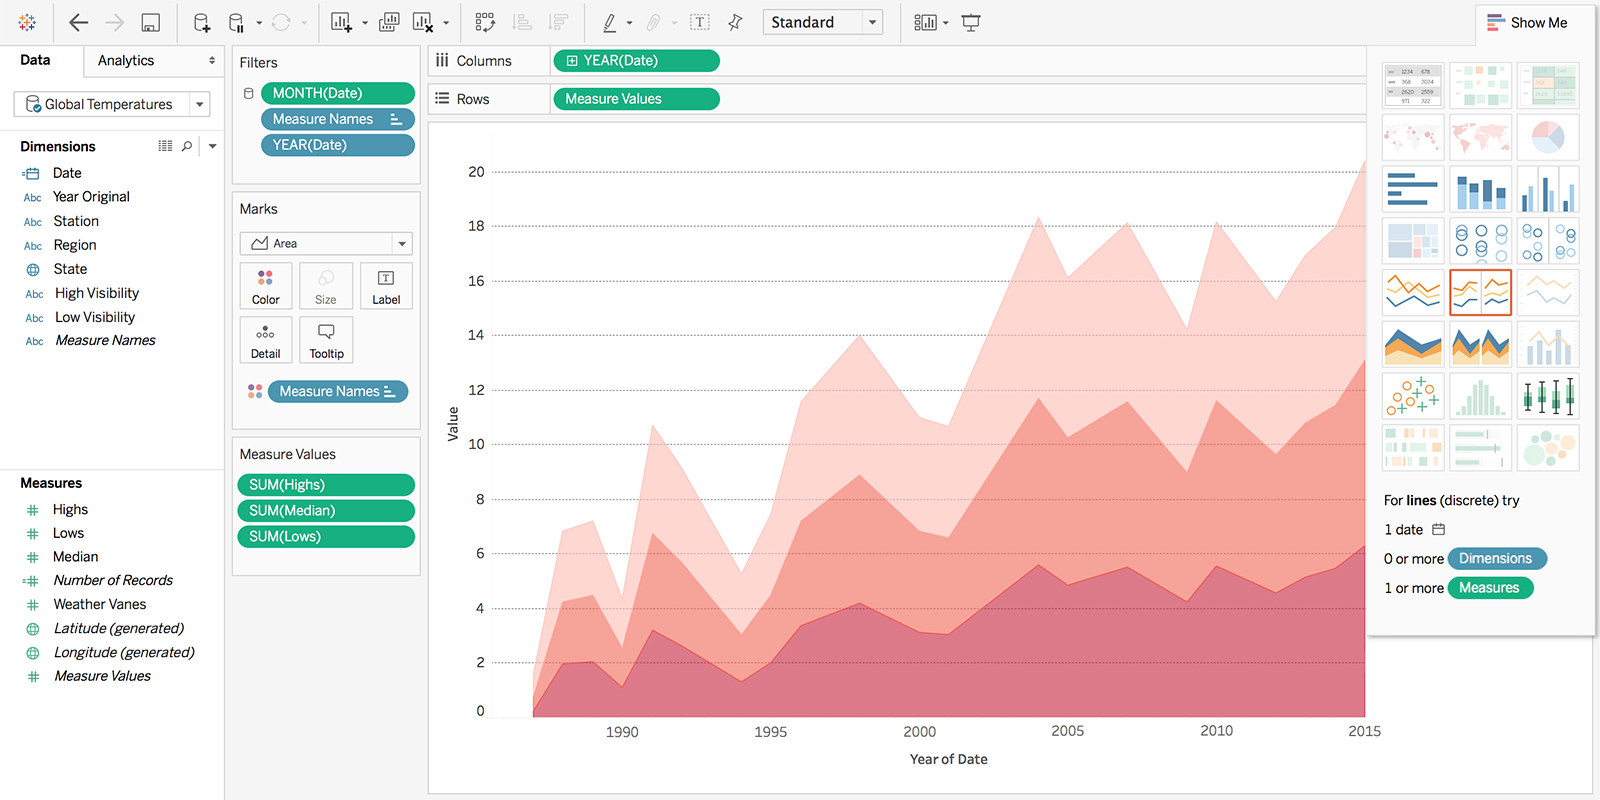
Define custom territories, filter across data sources, highlight data in context, and more with new visual analytics capabilities. Quickly spot patterns and group your data with drag-and-drop cluster analysis. With custom territories, Tableau 10 enables deeper understanding of your data. Trade in parameters or filter actions for cross data source filters.
Discover specific data in context, and perform ad-hoc comparisons with live highlighting to quickly spot trends in your data. Go above and beyond with variable-width bar charts, cascade charts, and Marimekko charts with mark sizing control.
Even advanced analytics are deeper. Take your groups farther by using them in LOD expressions and other calculations. Easily author and see the results of your table calculations with a redesigned interface. And use expressions directly within the dimension field of your level of detail expression for quicker results—without creating an additional calculated field.
Data Breakthroughs
Connect and prep your data faster. Join data from different data sources, like SQL Server and Oracle. Then, publish the integrated data source to Tableau Cloud or Tableau Server to collaborate with others. Enjoy connecting directly to your data from Google Sheets, QuickBooks Online, Kognitio, and more with new connectors. Leverage new and updated map data for countries around the world, and work smarter with auto-detecting geographic roles in more languages.
Did we mention Oracle improvements? Leverage Oracle stored procedures as a data source. Plus, enterprise environments utilizing Active Directory with Tableau can now have a seamless single sign-on experience with Oracle and Tableau.
Catch extract refresh issues before they become a problem. Tableau can alert you to possible extract refresh issues via email, so they can quickly be resolved. The updated Tableau Cloud Sync client now emails data source owners if a refresh fails.
Beautiful by Design
With a fresh look and feel, beautiful viz defaults, and new formatting controls, your vizzes are even more impactful. Enjoy a clean, beautiful canvas for analytics, with new iconography, typography, colors, and inline titles.
Your vizzes are even hotter thanks to new workbook defaults, featuring new viz color palettes and updated line weights. Change the style of your entire workbook with a click. And tie it all together with a custom Tableau font that makes your text crisp, clear, and communicative—even at small sizes.
Delightfully Mobile
Get Tableau on any device, now including Android. You asked. We delivered. Plus, you can now design, customize, and publish a single dashboard that includes optimized views for tablet and phone using device designer. And deploy Tableau Mobile across your organization with mobile device management support from AirWatch and MobileIron.
Do More on the Web
With dashboard authoring on the web and revision history at the ready, it’s easier for everyone to use Tableau when and where they want. Add published data sources and author dashboards right in your browser. See what’s hot in your organization with baked-in analytics on data sources: View usage stats at a glance and favorite the ones you use the most.
Then, with revision history for workbooks and data sources, quickly roll back to older versions if you want. Or cap revisions in Tableau Server settings. Finally, publish workbooks and data sources faster and with more control, thanks to our publish flow improvements.
Self Service at Scale
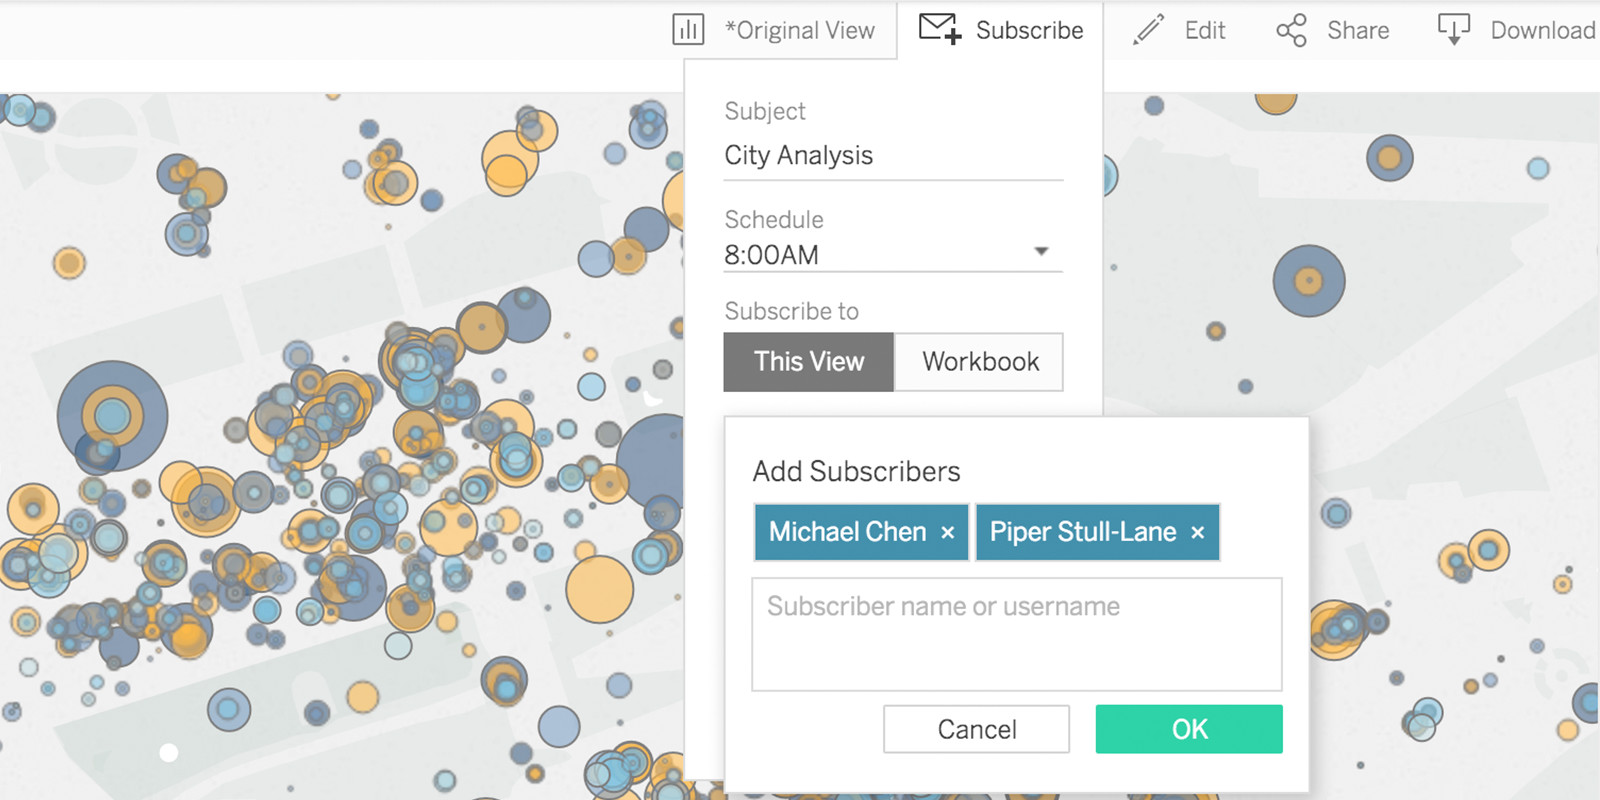
We've got powerful governance and extensibility features for scalable enterprise deployments. Easily share vizzes with your team, subscribe others with a click, and enjoy new administrative views that give insight into licensing and usage of Tableau Desktop.
We've added two new functions to the JavaScript API that enable programmatic access to data in your visualizations. The Tableau REST API has been expanded with more metadata information options, user result filtering, and the ability to return your Tableau Server version. Web Data Connector 2.0 is easier to use, allowing you to build more flexible and powerful connectors, refresh external ETL jobs from Tableau while remaining in the flow of your analysis, and supports multiple tables and joins.
Other updates include a new Document API that keeps your data source connection up-to-date, and site-specific SAML IdP configuration, which gives you control over your Tableau Server user login experience. When you open a published workbook, Tableau Desktop only connects to the data sources required to display the current sheet’s data. In other words, see your data a whole lot faster. In Tableau 10, we are caching the initial workbook load to give you faster workbook performance. Enjoy speedier load times, instant updates based on your interactions, and more.