Back to US Election 2020 Data Home
Survey demographics
Tracking how survey respondents identify, where they live, and whether or not they are registered to vote.

Survey methodology

These data come from a series of SurveyMonkey polls collected continuously since June 1, 2020, with about 35,000 responses collected every week. Respondents were selected from the more than 2 million people who take surveys on the SurveyMonkey platform each day.
Data have been weighted for age, race, sex, education, and geography using the Census Bureau’s American Community Survey to reflect the demographic composition of the United States age 18 and over. Depending on the exact visualization and any filters selected, other factors—like vote registration or state—are also taken into account.
Visualization best practices

For each of these categories, a simple dot chart gives users a quick snapshot of the respondents’ identification relative to the rest of the cohort. Stacking these charts across the dashboard makes it possible to capture the full spectrum of participants and survey weightings in a single view. And by allowing users to filter by state and registration status across the dashboard, it is easy to drill down into a specific interest without losing the clarity of the chart.
"We’re on track to survey more than a million people nationwide by Election Day, and this page will provide a continuous, interactive look at our survey respondents in terms of demographic characteristics and partisan affiliation. Use the dropdowns to filter by state or by month, or to look at the breakdowns for registered voters vs. the U.S. adult population as a whole." —Laura Wronski, Research Science Manager at SurveyMonkey
Explore more Election 2020 vizzes
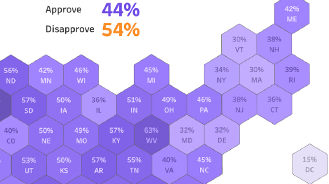
Job performance approval
Asking respondents about their perceptions of how different parts of the government have responded to the COVID-19 crisis.
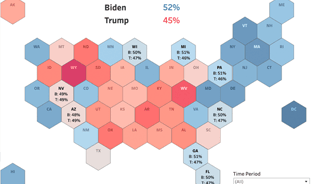
Candidate preference map
Asking respondents: "If the 2020 presidential election were being held today among the following candidates, for whom would you vote?"

Candidate preference demographics
Explore support for Biden or Trump among different groups of voters.
Recommended content
