Meet the Tableau Community Equity Task Force


What does the rest of 2022 hold for the Tableau Community? We have big plans and even bigger wheels to set in motion, and we’ll be working closely with the Community Equity Task Force on guiding and supporting our shared efforts within the community. In January, we announced applications for our new class of CETF members, and we’re so excited to introduce you to them.
But first, let me introduce the Tableau Community Equity Task Force program itself!
Who are we?
An action-oriented group of diverse voices focused on the Tableau Community's fight for equality, inclusion, and equity.
What is our vision?
We strive to help promote an inclusive and approachable community for all data users, no matter their race, gender, sexual orientation, ability, physical appearance, religion, age, or neurodiversity. We aim to foster a community where we keep equal representation at the center of all our conversations within Tableau’s Community programs.
What are some of our 2022 goals?
This group will continue to focus on the mission and values that we set forth when the program was started, and the new and existing classes of CETF members will take on a significant role in our Data + Diversity content in 2022, including blog posts, visualizations, events, and more.
- Make Tableau Community content more accessible based on languages and other formats
- Remove barriers to entry into the Tableau Community to help everyone feel welcome
- Increase regional representation in the nominations of our Community Leader programs
- This group will also host quarterly town hall meetings to have discussions around difficult topics and issues regarding race, equity, and inclusion in the data community.
Now, let’s get to know our new and existing Tableau Community Equity Task Force members, with our new class of seven being introduced first!
Meet the Community Equity Task Force Members
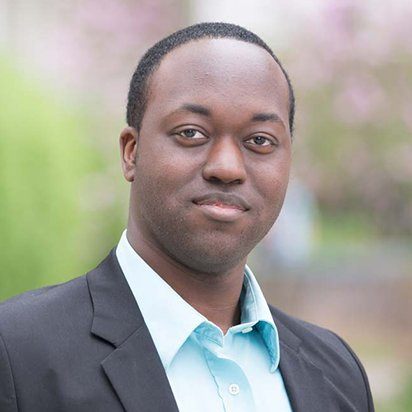
Olushola Olojo (he/him)
Aldershot, UK
Shola is an Insights Manager at Samsung Electronics UK. Beginning his Tableau journey in October 2020, he valued the embracive culture of the #DataFam community, and the tremendous support system Tableau offers to new users. By coupling a unique story-telling element in his Medium blogs and visualizations, Shola explores how data can drive social change in Africa. He asserts that the #Viz5 initiative highly resonates with him as it calls to the forefront key societal issues impacting the continent. Outside of data, Shola competed at the UK Championships & Olympic Trials in the Triple Jump.
Kimly Scott (she/her)
Melbourne, Australia
Kimly works with Tableau in her job as an Analytics Manager, helping her organization use data to make better business decisions. Outside of work, she is part of the Tableau Community, participating in community initiatives and vizzing about social issues such as gender equality, diversity, and refugees. She has recently been recognized as a Tableau Public Ambassador.
Victor Calderon (he/him)
Marietta, Georgia (United States)
Victor was born and raised in Guayaquil-Ecuador, and currently resides in Atlanta, Georgia (USA) where he works as a Sr. Data Analyst in the Marketing team of a Fortune 500 company. He has led the Latino/a/x Employee Resource Group at his company for the last 3 years and was recognized as a Community Leader for providing computer literacy classes to non-English speaking adults. He also co-leads the Latino/a/x (Comuni[datos]) Tableau User Group, created during the pandemic with a mission to "Conectar a la Comunidad Latina" (Connect the Latin Community) and provide opportunities for growth, learning, and influencing change. In his spare time, he loves traveling, video games and grilling.
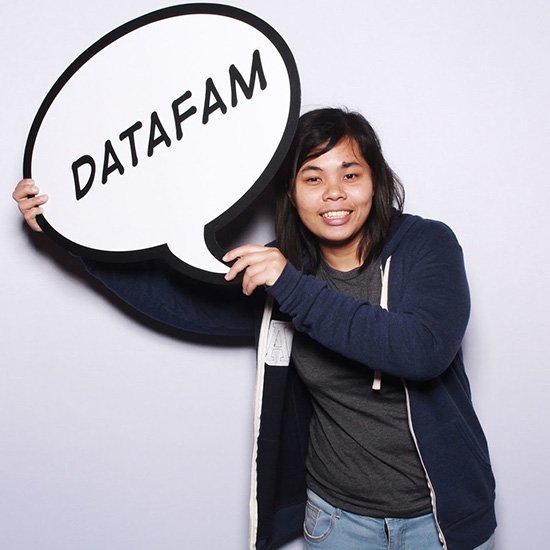
Nai Louza (she/her/they/them)
New Haven, Connecticut (United States)
Nai has been a fond member of the Tableau Community for 7 years. During that time, she has seen how data can transform not only insights, but also relationships among data geeks, evangelists, and Jedis. She is committed to making data accessible for all and empowers people to navigate the insights hidden in tangled messes of numbers and figures. She is passionate about the intersection of business, innovation, and technology. Nai received her BA in Psychology from the University of British Columbia, an MSc in Management from University College London, and an MBA from the Yale School of Management. She is a life-long student dedicated to forever questioning her assumptions and always exploring ways to hone her craft.
Vinodh Kumar V R (he/him)
Tamil Nadu, India

Vinodh Kumar is a Tableau Visionary, 2x Tableau Public Ambassador, and a Tableau Public Featured Author. He is a co-lead of various community initiatives like #TheSDGVizProject, #Mentoringmeetup, #VizConnect, #Viz2Educate and #Viz4climateAction. He is also the leader of the Chennai Tableau User Group (#ChennaiTUG). He is a long-time active social worker and an avid supporter of the SDGs. He loves maps and spatial analysis and is always in search of hidden secrets in data that can help change the world. He is a data visualization evangelist and strives to onboard more students into data viz journeys from India and its neighboring countries.
Rupesh Kumar (he/him)
Nice, France
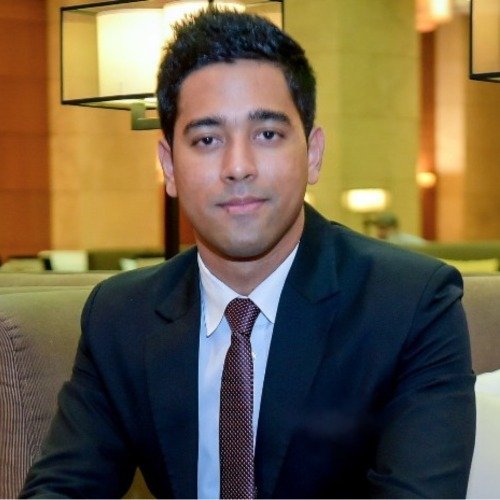
Rupesh is a passionate Data Scientist & Data Analyst skilled at providing innovative business solutions. He wears many hats outside of being an AI Research Fellow at AIM Research Center on Artificial Intelligence in Paris / Lyon—a leader driven by passion and motivation, empowering teams to go above and beyond in style. Having premium experience in Europe, North America, the Middle East, and Asia, Rupesh understands what equality, diversity, and empowerment mean to our generation. He’s looking forward to inspiring the world one individual at a time.
Jose San Miguel (they/them)
Dallas, Texas (United States)

Jose is a DEI practitioner and inclusive designer based in Dallas, Texas. They use data storytelling to drive scalable, theory-informed DEI strategy for multi-national corporations. They dream of liberation and are inspired by inclusive designers, social scholars, and community stewards who work to build equitable worlds. Outside of work, they’re passionate about Survivor, Maison Margiela, and disco balls.
Sedale McCall (he/him)
Washington, D.C. (United States)
Sedale is a digital insights analyst with a passion for telling impactful data stories. His work looks at digital conversations to uncover perceptions of clients’ brands and issues. When not working with Tableau and hanging out with the #datafam on social media, Sedale is passionate about discussing social justice issues, both personally via Twitter (@SedaleM) and as a communications volunteer for the Fairfax County NAACP.
Abisola Oni (she/her)
Lagos, Nigeria

Abisola is an analytics professional with over six years of experience in driving growth for technology-based businesses. Her interests lie in the intersection of technology, business, social impact, and community. She is also Africa’s first Tableau Visionary.
Siroros Roongdonsai (she/her)
Bangkok, Thailand
Siroros is currently a Senior BI at Food Panda and has been working as a data analyst and data scientist in the Financial Industry for 8 years. She has been a part of the Tableau Community for 3 years and is currently a Tableau Public Ambassador and Thailand Tableau User Group Leader since 2018. Besides data, she loves gardening and doing crafts.
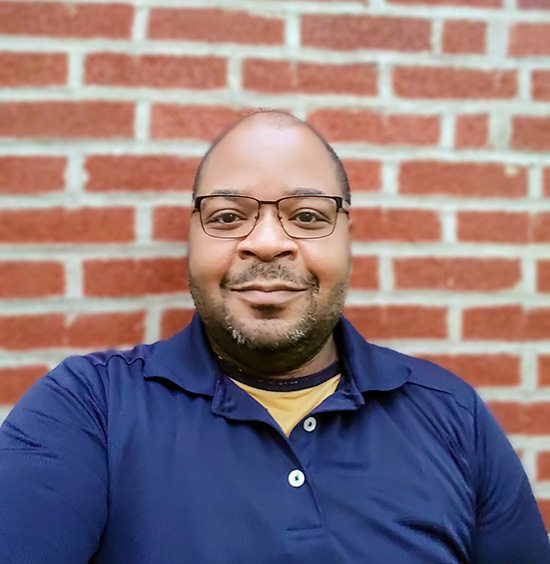
Sekou Tyler (he/him)
Nashville, Tennessee (United States)
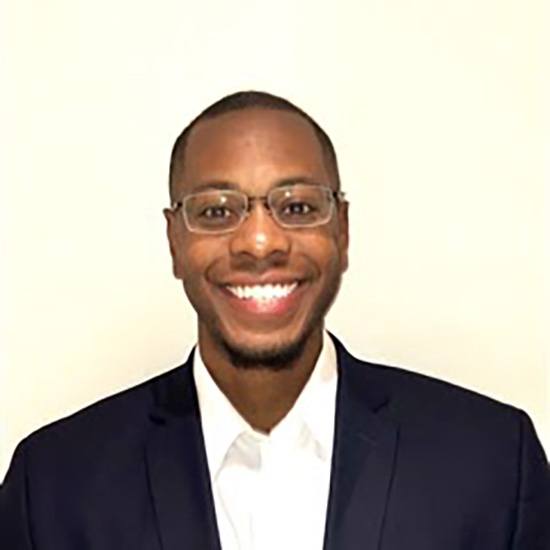
Sekou is a self-proclaimed “data geek”: a computer aficionado who combines the scientific elements of data analysis with the narrative properties of data visualization. His degrees and extensive certifications have allowed him to use his version of data storytelling in multiple industries. Sekou is fascinated by the learning process; he actively seeks out ways to improve his skill set and utilizes different tools to display actionable data to ultimately empower people to make better data-driven decisions. Aside from all things data, Sekou enjoys speaking, mentoring, and reading. He is a Tennessee Titans and LA Lakers fan, but most of all he’s happiest spending time with his wife and hanging out with friends and family.
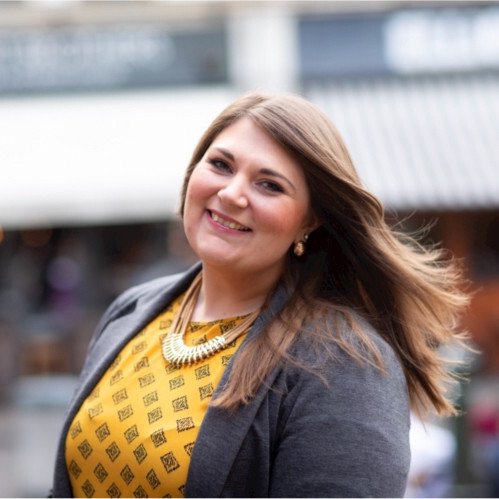
Chantilly Jaggernauth (she/her)
Philadelphia, Pennsylvania (United States)

Chantilly’s mission is to empower corporations and individuals through the use of data visualizations and data analytics. She is a two year Tableau Visionary who specializes in data visualization, data analytics, design, and training.
Currently, she is the Vice President of Data Visualization and Training at Lovelytics based in Arlington, VA. In addition to her day job, Chantilly is the founder and CEO of the non-profit organization, Millennials and Data (#MAD). Through #MAD, she works to bridge the data literacy and analytical skills gap by training, mentoring, and preparing millennials to enter a data- driven global environment.
Swagat Kumar Jena (he/him)
East Singapore, Singapore
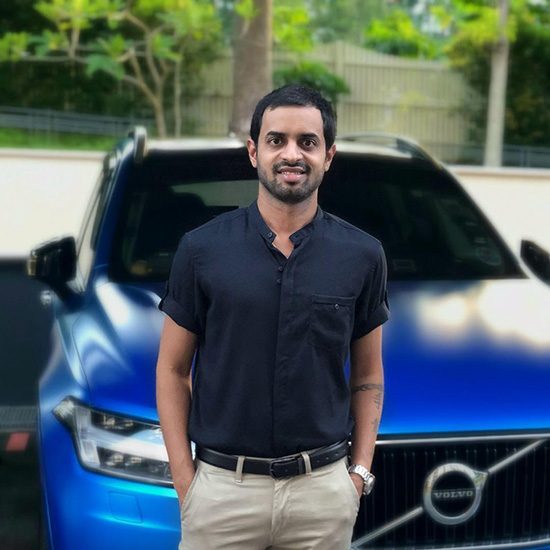
Swagat Kumar works as a Data Visualization Consultant in Singapore. He is also a Tableau Public Ambassador who participates in various community programs like Makeover Monday and Viz For Social Good. He takes time out of his day to help people with Tableau related queries, and always believes that there is so much we can do for this society through our acts of kindness and righteousness.
Allen Hillery (he/him)
New York, New York (United States)
Allen serves as part time faculty at Columbia University’s Applied Analytics program. He has extensive experience in developing and executing data analysis and integrating results into marketing programs and executive presentations. Allen is very passionate about data literacy and visualization and curates an article series that focuses on the importance of creating data narratives and spotlighting notable figures on how their use of storytelling made major impacts on society.
Sarah Bartlett (she/her)
London, United Kingdom
Sarah is a Tableau Enablement Consultant at Red Hat. She was introduced to Tableau in late 2014 while working as an analyst and soon after discovered her passion for data visualization through participating in various community initiatives including #MakeoverMonday and #VizForSocialGood. In 2018, Sarah became the first woman to compete on stage at Iron Viz Europe and the experience prompted her to launch #IronQuest—a community data visualization initiative designed to prepare individuals for the Iron Viz feeder competitions. Sarah is currently a Tableau Visionary and Social Ambassador, and is passionate about welcoming newcomers from diverse backgrounds to the Tableau Community.
You can find the full list of current and former CETF members here.
If you want more information on the Tableau Community Equity Task Force and our mission, you can find the introduction to the program here, and you can see the CETF viz gallery on Tableau Public here.
Autres sujets pertinents

Using an Equality Lens in Data Visualization
 22 février, 2023
Abonnez-vous à notre blog
Recevez toute l'actualité de Tableau.