DataFam Roundup: September 13 - 17, 2021


Dig into the latest DataFam Roundup—a weekly blog that brings together community content all in one post. As always, we invite you to send us your content—and the DataFam content from your peers that have inspired you! Find the content submission form here.
DataFam content
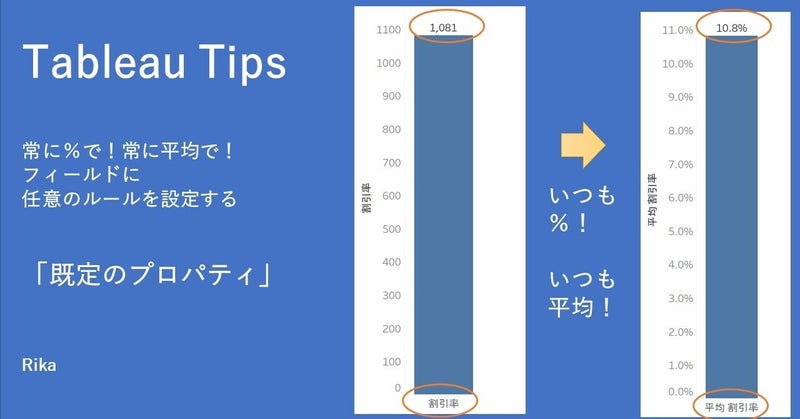
Rika Olga: Tableau Tips 常に%で!常に平均で! フィールドに 任意のルールを設定する「既定のプロパティ
Dive into content created by the Tableau Community:
- David Browne: Tableau Community Forums 2021 June Survey Results and Feedback
- Kevin Flerlage, The Flerlage Twins: Ten Tips including "Show the Axis on the Top but Not the Bottom"
- Priyanka Dobhal: Analyzing the Movies based on Cinderella
- Rika Olga: Tableau Tips 常に%で!常に平均で! フィールドに 任意のルールを設定する「既定のプロパティ Tableau Tips Always in%! Always on average! "Default property" to set arbitrary rules for fields (Japanese)
- Pearle Lundeen: Stuck In a Viz Rut? 3 Sources of Inspiration to Get Unstuck!
- Nicole Lillian Mark: Want to dataviz better? Participate in #MakeoverMonday!
- Allen Hillery and Sarah Nell-Rodriquez, Be Data Lit: Another Data Podcast? But wait, there’s more…
- Yamil Medina, Michael Perillo, Aaron Simmons with special guest Dalton Ruer, Data Meaning: 3@3 Live: A Mystery Chart Show
- Jared Flores, WhatTheViz: How to do a Running Total in Tableau Prep: Put some Prep in your Step
- Fabio Fantoni, Info Data: Paralimpiadi Tokyo 2020: le medaglie, i numeri e tutto quello che c'è da sapere - Info Data Tokyo 2020 Paralympics: medals, numbers and everything you need to know (Italian)
- Cndro: Previous Value Function in Tableau
Upcoming events and community participation

Tableau Conference Register Today!
- Tableau Conference: Join Tableau and the world's largest data community online for three days of learning, connection, and inspiration. Register Today!
- Iron Viz, the world’s largest virtual data visualization competition—ignites and showcases the power of the Tableau Community, giving you the opportunity to interact with data rockstars worldwide. Three finalists will advance to the 2021 Iron Viz Championship this November at Tableau Conferece.
- #Viz4Climate Action Viz Challenge - Participate by October 10th! #TheSDGVizProject is thrilled to team up with Tableau for the #Viz4ClimateChange challenge leading up to the #COP26 UN Climate Conference. Submit your climate related vizzes by October 10th for a chance to win one of three $100 gift cards to the Tableau Store, and to be featured on Tableau Public! Vizzes will be judged by Andy Cotgreave (Tableau) and Clayton Aldern, data journalist at Grist. Click the link for challenge guidelines.
- September 17th, 10 AM CT – 11.00 AM CT: Join the third session of the Cup of Data series to expand on your Tableau CRM skills. The product team will demo their latest and greatest in a 'Release Jam'. Register for the event.
- Black Cinema Viz Challenge: Black Cinema Data Sets 2000-2021, instructions and links are provided upon registration
- Are you a visualization and storytelling expert? Enter the Data Viz Competition to showcase your data-driven artistic skills while competing for top prizes!
- Data Visualization: State of the Industry 2021: The purpose of this survey is to help the Data Visualization Society and the broader data visualization community understand the state of data visualization, the people who make it, the challenges they face, what can help practitioners, and where the field is headed.
Vizzes
Dennis Kao: The Thomas Guide - #IronQuest 2021.8
Catch this week’s Viz of the Days here and subscribe to get them emailed directly to your inbox.
Check out some inspirational vizzes created by the community:
-
Dennis Kao: The Thomas Guide - #IronQuest 2021.8
-
Aloysius Ong: 325 Weeks of Movies
-
Kasia Gasiewska-Holc: Dashboard Catalogue
Community Projects

Makeover Monday
Join the community every Monday to work with a given data set and create better, more effective visualizations.
Web: Makeover Monday
Twitter: #MakeoverMonday
Week 37: The 20 Largest Solar Power Plants
Workout Wednesday
Build your skills with a weekly challenge to re-create an interactive data visualization.
Web: Workout Wednesday
Twitter: #WOW2021
Week 36: When do extracts run during the day?
Sports Viz Sunday
Create and share data visualizations using rich, sports-themed data sets in a monthly challenge.
Web: Sports Viz Sunday
Twitter: #SportsVizSunday
September 2021: Sporting Heroes & Legends
Iron Quest
Practice data sourcing, preparation, and visualization skills in a themed monthly challenge.
Web: Iron Quest
Twitter: #IronQuest
September 2021: Sporting Heroes & Legends
Storytelling with Data
Practice data visualization and storytelling skills by participating in monthly challenges and exercises.
Web: Storytelling with Data
Twitter: #SWDChallenge
September 2021: envision education
Project Health Viz
Uncover new stories by visualizing healthcare data sets provided each month.
Web: Project Health Viz
Twitter: #ProjectHealthViz
September 2021: Biggest Healthcare Data Breaches
SDG Viz Project
Visualize data about Sustainable Development Goals provided by the World Health Organization.
Web: SDG Viz Project
Twitter: #TheSDGVizProject
COP26 UN Climate Change Conference: #VIZ4CLIMATEACTION
Preppin' Data
A weekly challenge to help you learn to prepare data and use Tableau Prep.
Web: Preppin’ Data
Twitter: #PreppinData
Week 33: Excelling at adding one more row
Real World Fake Data
Create business dashboards using provided data sets for various industries and departments.
Web: Real World Fake Data
Twitter: #RWFD
Dataset #12: Hospitality
Viz 2 Educate
Each month, create vizzes on global education syllabus topics as resources for teachers worldwide.
Web: Viz 2 Educate
Twitter: #Viz2educate
Topic: Microbiology
Diversity in Data
An initiative centered around diversity, equity & awareness by visualizing provided datasets each month.
Web: Diversity in Data
Twitter: #DiversityinData
August 2021: Refugee Data
Viz for Social Good
Volunteer to design data visualizations that help nonprofits harness the power of data for social change.
Web: Viz for Social Good
Twitter: #VizforSocialGood
Autres sujets pertinents

DataFam Roundup: April 8–12, 2024
 12 avril, 2024
DataFam Roundup: April 1–5, 2024
5 avril, 2024
DataFam Roundup: March 25–29, 2024
29 mars, 2024
Abonnez-vous à notre blog
Recevez toute l'actualité de Tableau.