DataFam Roundup: July 26 - 30, 2021


Dig into the latest DataFam Roundup—a weekly blog that brings together community content all in one post. As always, we invite you to send us your content—and the DataFam content from your peers that have inspired you! Find the content submission form here.
DataFam content
James Zirbes, Tessellation: How to Create Custom Buttons in Tableau
Dive into content created by the Tableau Community:
- Julie Laux: Rapid Dashboarding: 5 step process to dashboard success
- Kevin Flerlage, The Flerlage Twins: A Little Design Makes a World of Difference
- Vani Agarwal, Tableau Tips and Tricks: How to make data live on Tableau Online and put it on refresh
- Adam Mico, Keyrus US: Adding Tableau CRM to Your Tableau Public Visualization
- Dawn Michelle, Tech Tips Girl: Create a Drill-Down Proportional Bar Chart with Set Actions
- Tim Ngwena, Tableau Tim: Bulk rename fields in Tableau Prep: New in Tableau 2021.2
- James Zirbes, Tessellation: How to Create Custom Buttons in Tableau
- Isha Garg, Towards Data Science: Bored of using Bar charts?
- Tableau Ambassador Spotlight: Diego Parker
Upcoming events and community participation
- Join an upcoming Tableau User Group event by checking out all the virtual Tableau User Group events here
- Forums Unanswered Questions Blitz: For the month of July we are hosting a Blitz where we focus on tackling any Unanswered Questions in our Community.
Vizzes
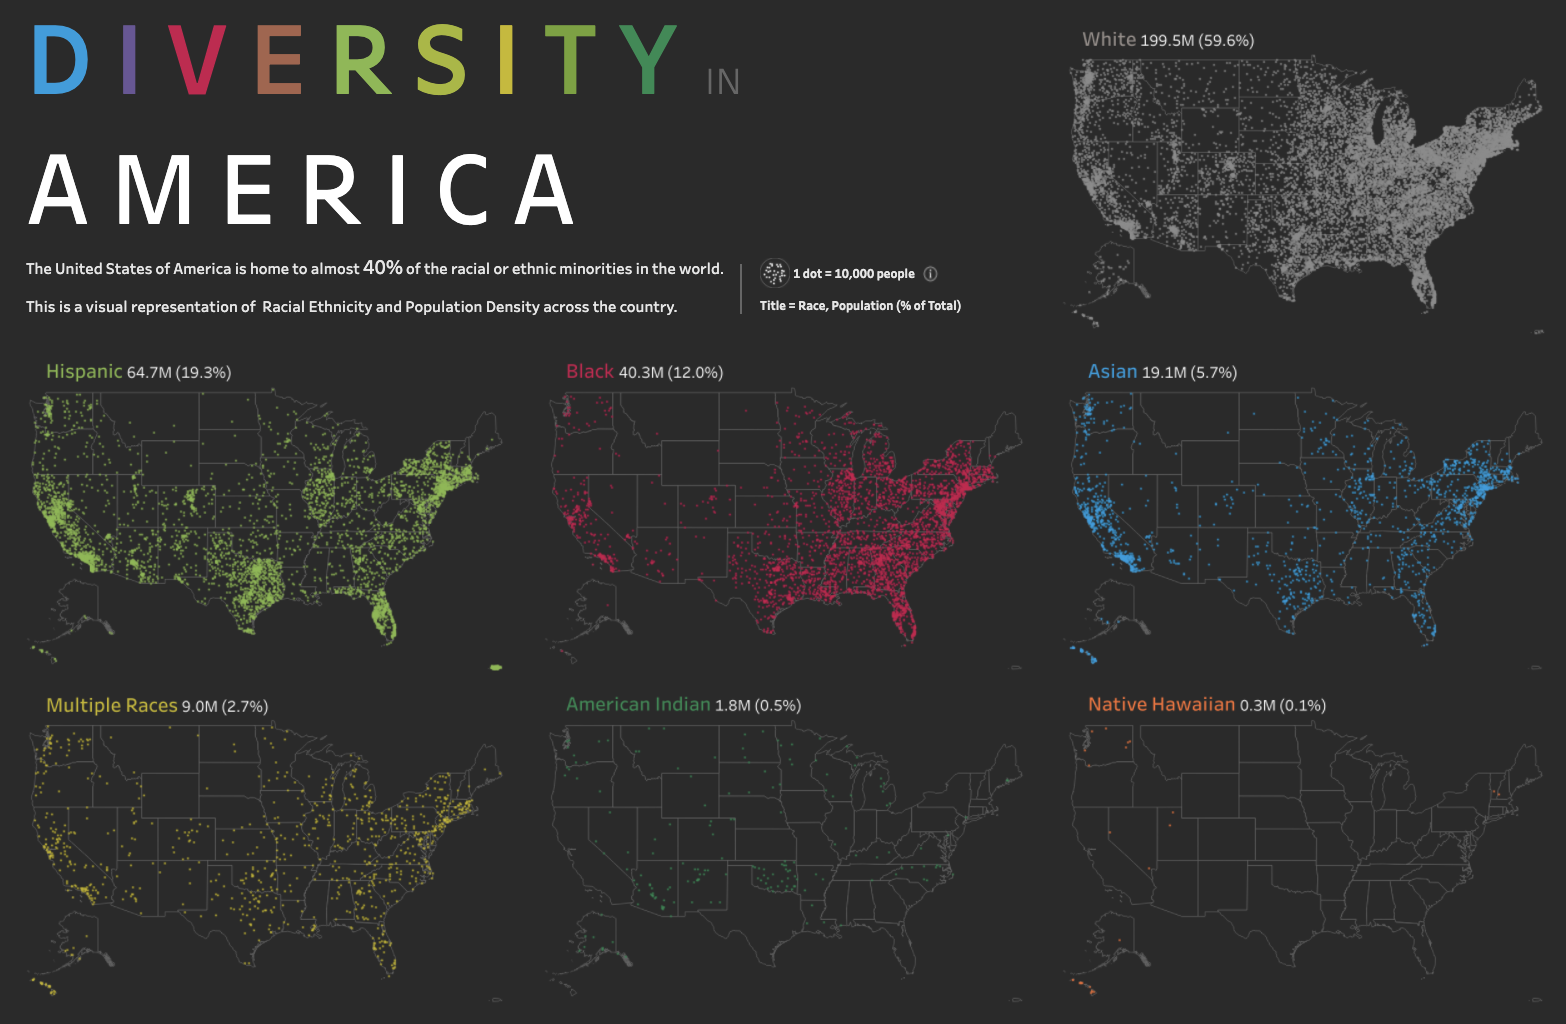
Naveen Mithare: Diversity in America
Catch this week’s Viz of the Days here and subscribe to get them emailed directly to your inbox.
Check out some inspirational vizzes created by the community:
-
Luke Abraham: What's Really Warming The World?
-
Naveen Mithare: Diversity in America

Makeover Monday
Join the community every Monday to work with a given data set and create better, more effective visualizations.
Web: Makeover Monday
Twitter: #MakeoverMonday
Week 30: America’s Racial Breakdown by State
Workout Wednesday
Build your skills with a weekly challenge to re-create an interactive data visualization.
Web: Workout Wednesday
Twitter: #WOW2021
Week 30: Let’s go Streaking!
Sports Viz Sunday
Create and share data visualizations using rich, sports-themed data sets in a monthly challenge.
Web: Sports Viz Sunday
Twitter: #SportsVizSunday
July 2021: The Olympics
Iron Quest
Practice data sourcing, preparation, and visualization skills in a themed monthly challenge.
Web: Iron Quest
Twitter: #IronQuest
Storytelling with Data
Practice data visualization and storytelling skills by participating in monthly challenges and exercises.
Web: Storytelling with Data
Twitter: #SWDChallenge
July 2021: exploring unit charts
Project Health Viz
Uncover new stories by visualizing healthcare data sets provided each month.
Web: Project Health Viz
Twitter: #ProjectHealthViz
SDG Viz Project
Visualize data about Sustainable Development Goals provided by the World Health Organization.
Web: SDG Viz Project
Twitter: #TheSDGVizProject
Goal 17: Partnerships for the Goals
Preppin' Data
A weekly challenge to help you learn to prepare data and use Tableau Prep.
Web: Preppin’ Data
Twitter: #PreppinData
Week 29: PD x WOW - Tokyo 2020 Calendar
Real World Fake Data
Create business dashboards using provided data sets for various industries and departments.
Web: Real World Fake Data
Twitter: #RWFD
Dataset #12: Hospitality
Viz 2 Educate
Each month, create vizzes on global education syllabus topics as resources for teachers worldwide.
Web: Viz 2 Educate
Twitter: #Viz2educate
Topic: Microbiology
Diversity in Data
An initiative centered around diversity, equity & awareness by visualizing provided datasets each month.
Web: Diversity in Data
Twitter: #DiversityinData
June 2021: Pride Month
Viz for Social Good
Volunteer to design data visualizations that help nonprofits harness the power of data for social change.
Web: Viz for Social Good
Twitter: #VizforSocialGood
Autres sujets pertinents

DataFam Roundup: April 8–12, 2024
 12 avril, 2024
DataFam Roundup: April 1–5, 2024
5 avril, 2024
DataFam Roundup: March 25–29, 2024
29 mars, 2024
Abonnez-vous à notre blog
Recevez toute l'actualité de Tableau.