DataFam Roundup: April 5 - April 9, 2021


Welcome back! Dig into the latest DataFam Roundup—a weekly blog post that brings together what’s trending in the community all in one post. As always, we invite you to send us your content—and the DataFam content from your peers that have inspired you! Find the content submission form here.
DataFam blog content
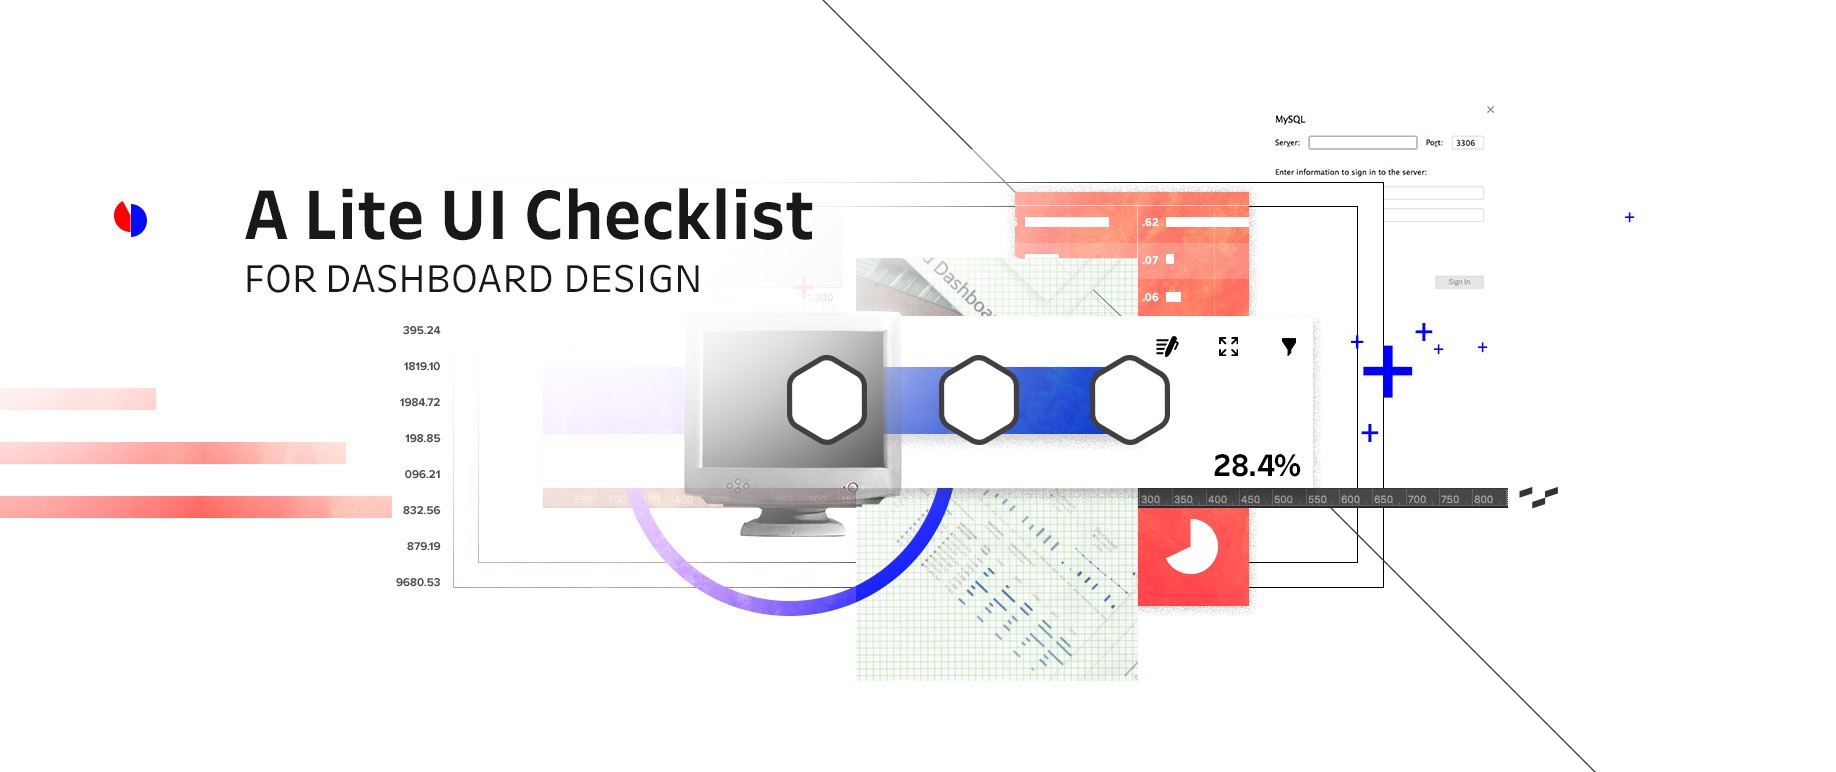
A Lite UI Checklist for Dashboard Design InterWorks
Dive into content created by the Tableau Community:
- Tableau Calculations? Follow this playlist Donabel Santos
- A Lite UI Checklist for Dashboard Design InterWorks
- Try to Avoid Color Legends Steve Wexler
- Organizing My Output: Ideas, Process & Execution Autumn Battani
- Data + Love - Ghafar Shah Zach Bowders
Upcoming events
DataDev Day
Join an upcoming Tableau User Group event:
- April 14, 2021: National K-12 TUG
- April 14, 2021: Chennai TUG
- April 16, 2021: Data + Women Latam
- April 21, 2021: Wisconsin Virtual TUG
- April 22, 2021: Data + Women Ireland
- April 26, 2021: Analytics TUG
- April 28, 2021: Ahmedabad Fireside Chat with Francois
Check out all the virtual Tableau User Group events here.
May 20, 2021 Tableau’s first DataDev Day: We’re excited to announce a new, one-day event dedicated to DataDevs and anyone interested in or using the Tableau developer platform to create integrations and customize Tableau for their organizations.
Summer, 2021 Data Book Club: If you're interested in reading a book about data and discussing it with others, sign up for the Data Book Club!
Vizzes
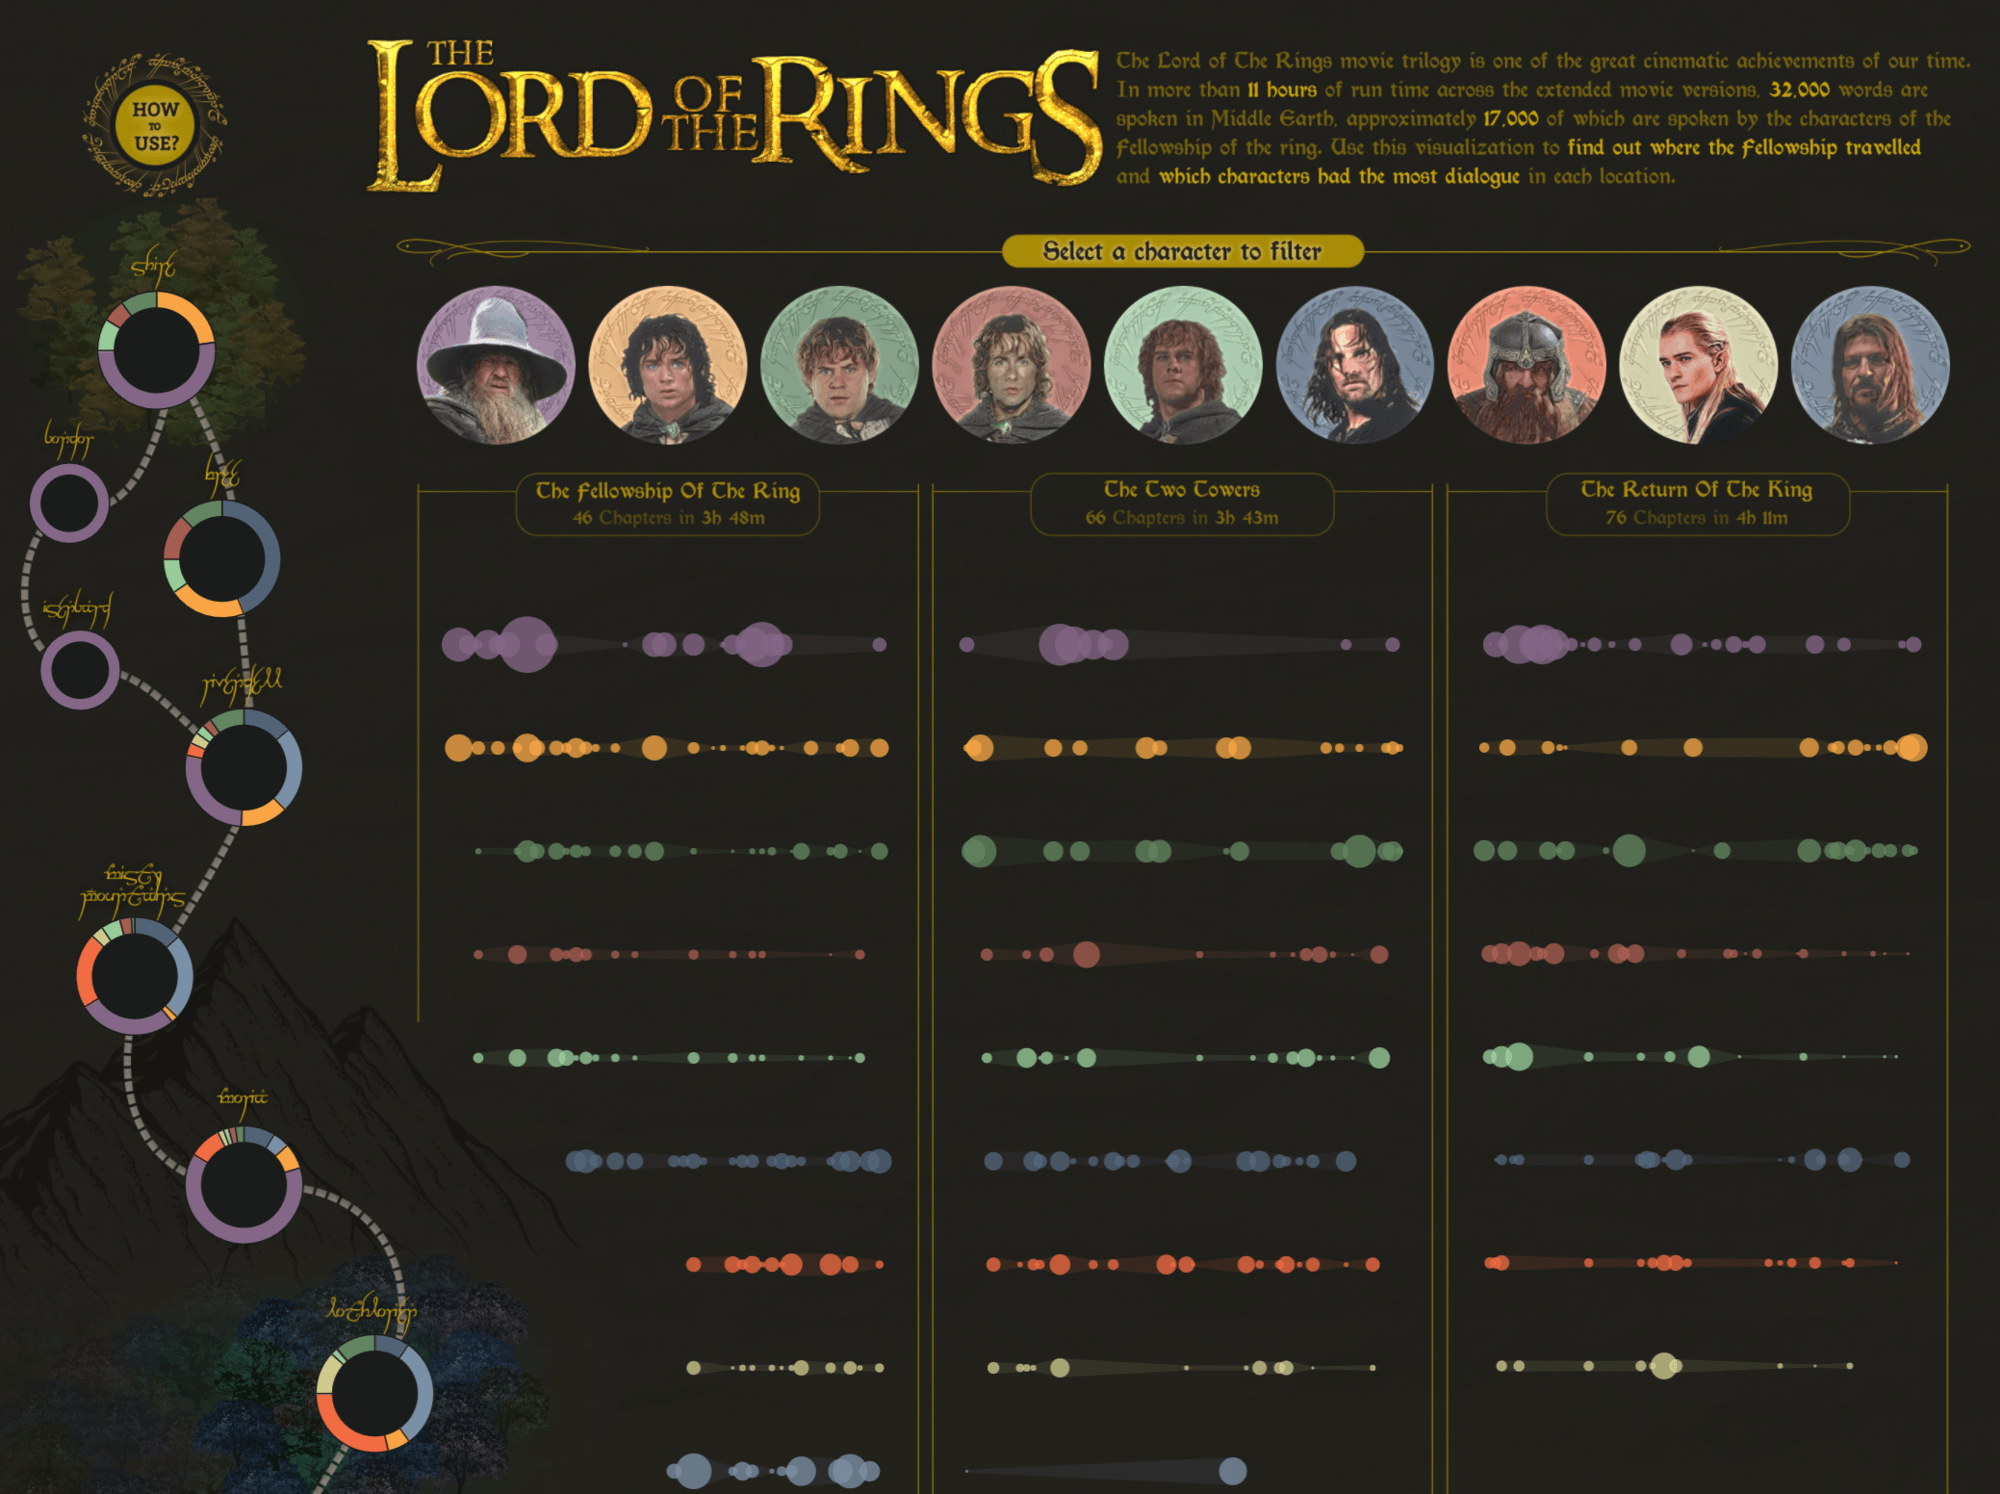
The Lord of the Rings, George Koursaros
Catch this week’s Viz of the Days here and subscribe to get them emailed directly to your inbox.
Check out some inspirational vizzes created by the community:
- Tableau Public Viz of the Day | #VOTD by Will Sutton
- The Lord of the Rings George Koursaros
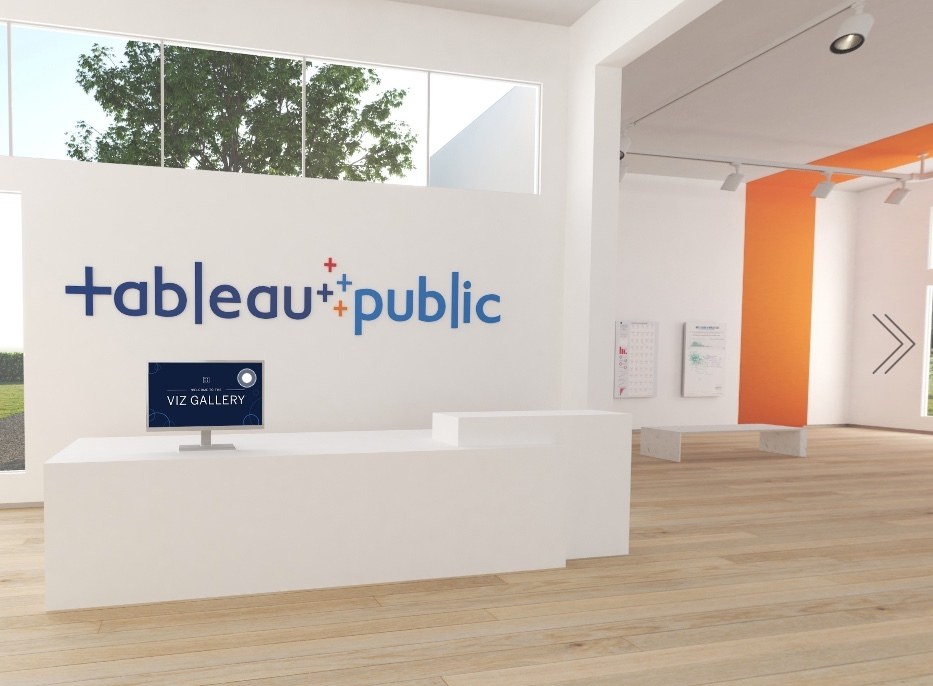
Check out the all new Tableau Public Viz Gallery—refreshed with two brand new exhibits relating to these Tableau virtual events: Government Summit (April 6) and Visualize Health 2021 (April 13)
Community Projects

Stay in the loop on the Tableau Community Projects:
Makeover Monday
Join the community every Monday to work with a given data set and create better, more effective visualizations.
Web: Makeover Monday
Twitter: #MakeoverMonday
Week 12: Multiclass Classification of Dry Beans
Workout Wednesday
Build your skills with a weekly challenge to re-create an interactive data visualization.
Web: Workout Wednesday
Twitter: #WOW2021
Week 13: Can You Recommend Profitable Return Customer Bundles?
Sports Viz Sunday
Create and share data visualizations using rich, sports-themed data sets in a monthly challenge.
Web: Sports Viz Sunday
Twitter: #SportsVizSunday
April 2021: NCAA D1 Lacross
Iron Quest
Practice data sourcing, preparation, and visualization skills in a themed monthly challenge.
Web: Iron Quest
Twitter: #IronQuest
March 2021: Games
Storytelling with Data
Practice data visualization and storytelling skills by participating in monthly challenges and exercises.
Web: Storytelling with Data
Twitter: #SWDChallenge
April 2021: ask & answer
Project Health Viz
Uncover new stories by visualizing healthcare data sets provided each month.
Web: Project Health Viz
Twitter: #ProjectHealthViz
March 2021: Adaptive Sports
SDG Viz Project
Visualize data about Sustainable Development Goals provided by the World Health Organization.
Web: SDG Viz Project
Twitter: #TheSDGVizProject
March 2021: Goal 15- Life on Land
Preppin' Data
A weekly challenge to help you learn to prepare data and use Tableau Prep.
Web: Preppin’ Data
Twitter: #PreppinData
2021 Week 14: Prep Air In-Flight Purchases
Real World Fake Data
Create business dashboards using provided data sets for various industries and departments.
Web: Real World Fake Data
Twitter: #RWFD
Dataset #7: Supply Chain Manufacturing
Viz 2 Educate
Each month, create vizzes on global education syllabus topics as resources for teachers worldwide.
Web: Viz 2 Educate
Twitter: #Viz2educate
April: Arts & Music
Diversity in Data
An initiative centered around diversity, equity & awareness by visualizing provided datasets each month.
Web: Diversity in Data
Twitter: #DiversityinData
March 2021: Adaptive Sports
Viz for Social Good
Volunteer to design data visualizations that help nonprofits harness the power of data for social change.
Web: Viz for Social Good
Twitter: #VizforSocialGood
Autres sujets pertinents
DataFam Roundup: April 15–19, 2024
 19 avril, 2024

DataFam Roundup: April 8–12, 2024
12 avril, 2024
DataFam Roundup: April 1–5, 2024
5 avril, 2024
Abonnez-vous à notre blog
Recevez toute l'actualité de Tableau.