Behind the Viz: James Smith talks Illustrator, Tableau Public, and Formula 1


Get to know your fellow Tableau Public authors with Behind the Viz, a blog series where we explore the people and processes behind our featured vizzes.
Meet James Smith! James is one of three leaders of Sports Viz Sunday, an initiative that encourages the community to create and share sports-themed visualizations. James is also the founder of Sportschord, a blog and prints business centered on creating data visualizations about sports. By day, James is a chartered accountant who recently joined Biztory UK as an Analytics Consultant, following four years of work with EY.
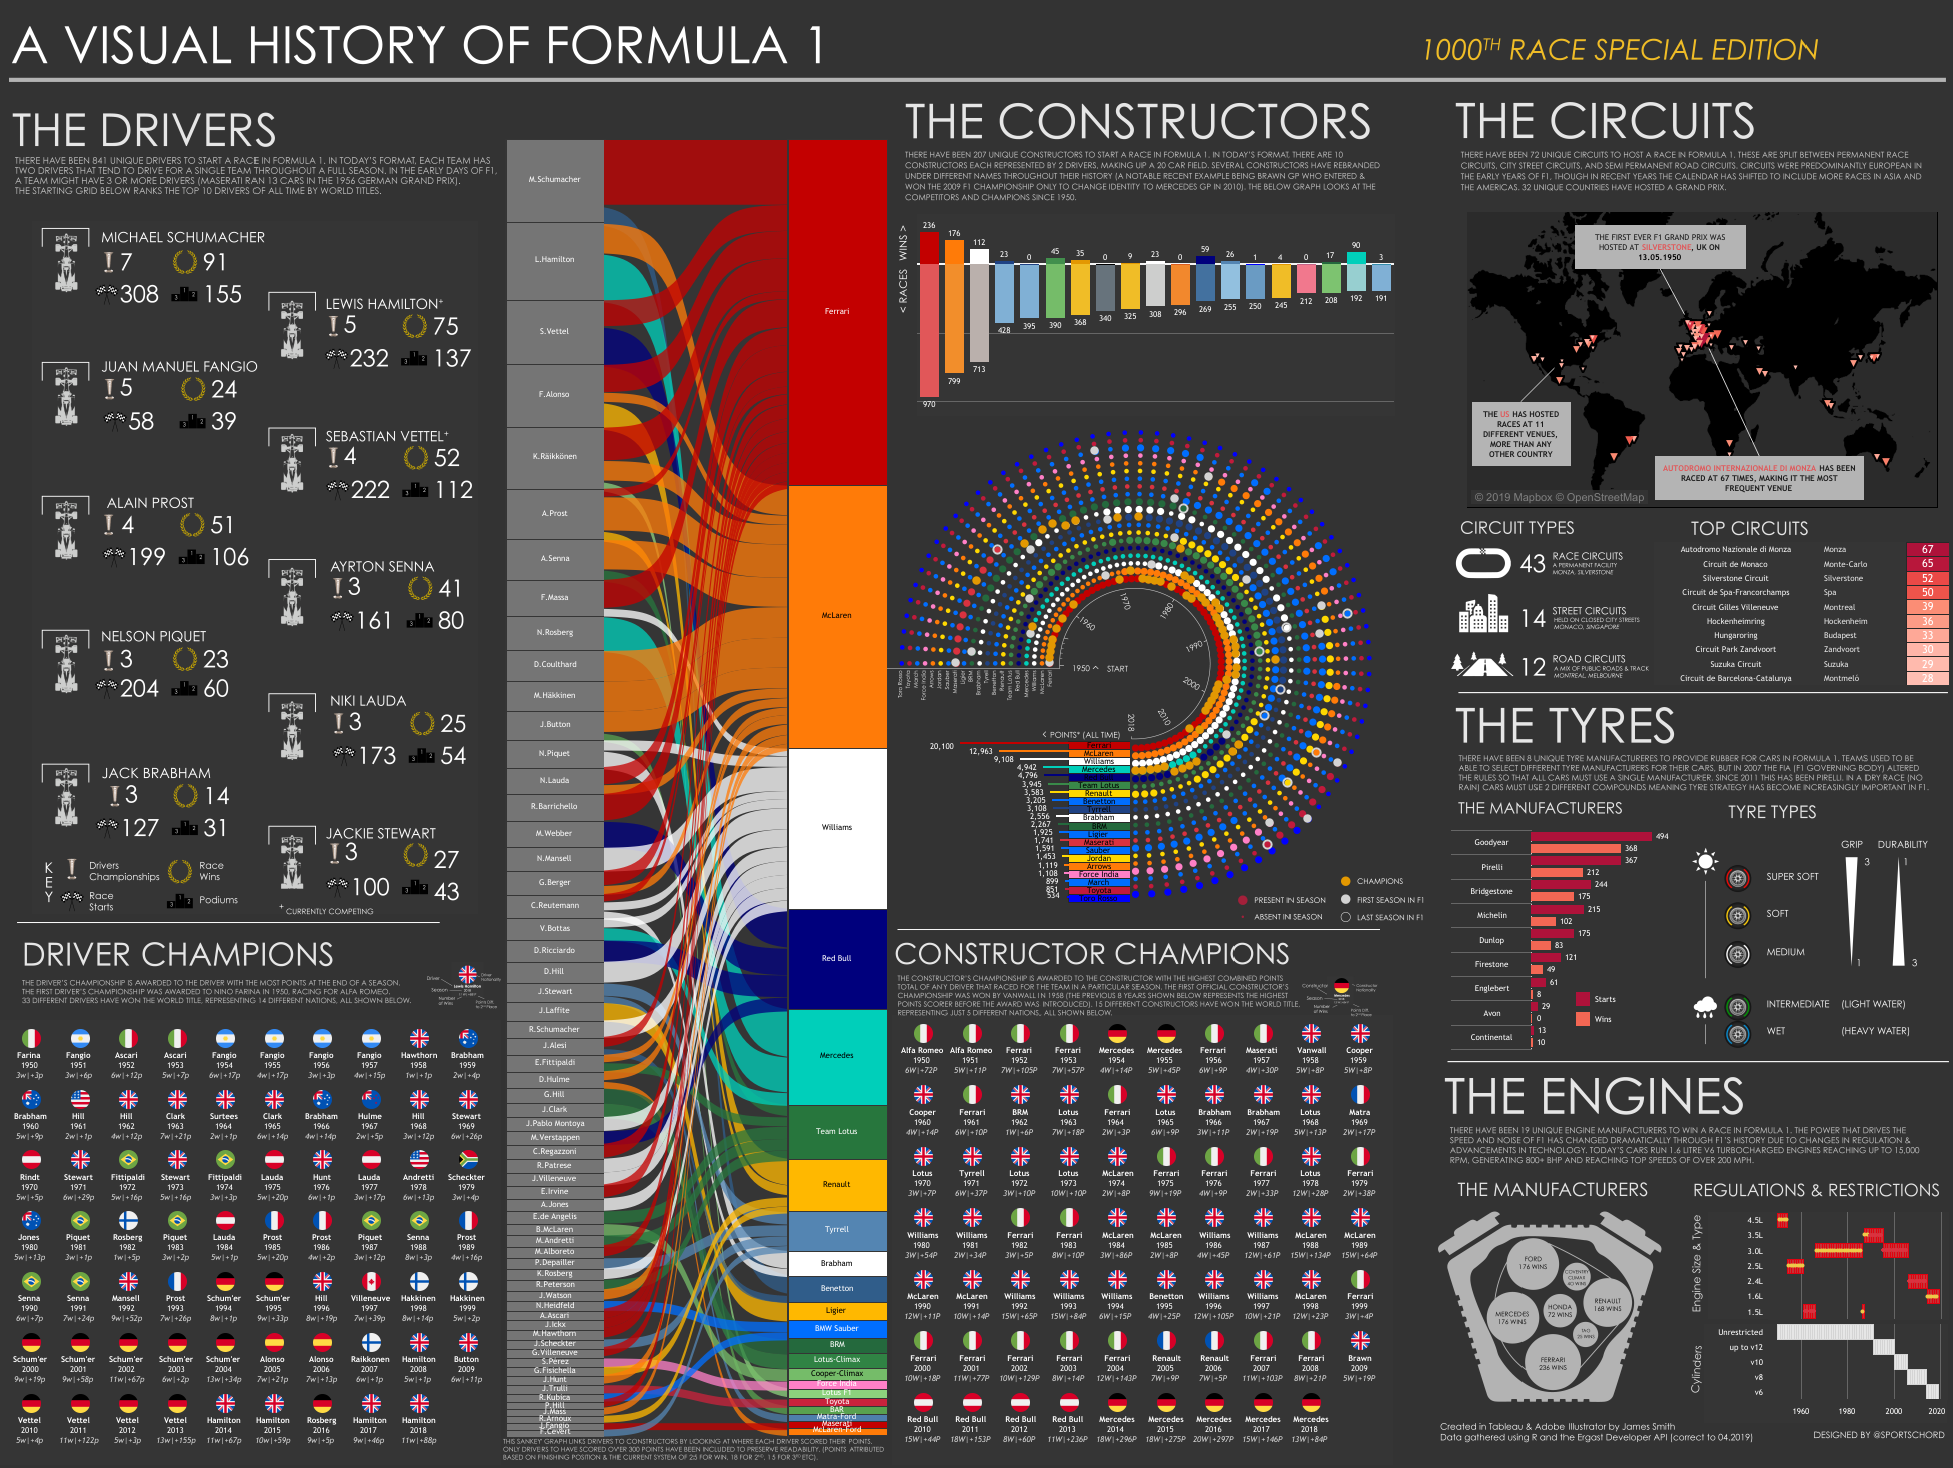
James has an awesome Tableau Public profile (go follow him!), and recently published a viz that illustrates the history of Formula 1 in incredible detail. This viz was selected as Viz of the Day!
The Tableau Community has been sharing their reactions to James's viz on Twitter. One of our favorite comments comes from Sarah Bartlett:
Congratulations @sportschord! This viz is insane!
— Sarah Bartlett (@sarahlovesdata) July 23, 2019
We reached out to James to learn more about his poster-ready visualization. In our conversation, we learned that James used a combination of Illustrator and Tableau Public to create the viz.
Now you may be wondering, “If you’re making an infographic or poster-style visualization, why not stick to Illustrator?” Read on to learn why James thinks Illustrator and Tableau Public are a winning combination, and why you should consider using Illustrator (or PowerPoint!) in your next visualization.
Let's take a look behind the viz!
How long have you been using Tableau Public?
I've been using Tableau Public for around two-and-a-half years now. I first started using Tableau Public to practice my data viz skills while working at EY. I imagine I'm not alone in looking back at some of my earlier vizzes in horror, but Tableau Public acts as a nice timeline of the learning that comes through experience. My profile also came in handy when interviewing for my new role at Biztory, where I've recently learned that I was known as “The Lord of the Rings Storylines” guy!
Why did you choose this topic?
I’m a huge F1 fan. So when I first started using Tableau, I used F1 data. I was familiar with the data, which helped me as I tried different charts and designs. Being familiar with the data made all the difference—I was genuinely interested in exploring and uncovering the stories in the data! That's one of the key reasons I started up Sports Viz Sunday with my co hosts Simon Beaumont and Spencer Baucke—using data that interests you is a great way to learn Tableau!
What was the hardest decision you made when creating this viz?
The goal of the visualization was to condense sixty-nine years, one-thousand races, and hundreds of drivers and teams into a single story that fit on a standard poster. It was incredibly difficult choosing what to include or omit. I decided to attribute the different sections of the page to the most important parts of F1. If I had more space, I would have liked to create a section on the great rivalries that have defined decades and a section on pit-stops and their innovations through the years.
What is your favorite new Tableau trick? How can others use it?
This visualization was created using a combination of Illustrator and Tableau. Why not create the whole thing in Illustrator? While Illustrator is an incredible graphic design tool that lets me create custom shapes and text, its out-of-the-box charting functionalities are limited (unless you want to spend ages mapping data to shapes!). With Tableau, I’m able to make use of interactivity and, after each F1 race, refresh the data behind the charts at the click of a button. Don’t have Illustrator? PowerPoint is another great tool that you can leverage for your next visualization’s design elements.
What is the best music to listen to while vizzing?
I don't have a power playlist, but I've always been a fan of the Red Hot Chili Peppers so I'll go with them!

James’s Tableau Public profile is a great place to get inspired. He regularly posts stunning vizzes that bring together sports, data analysis, and design. Follow him on Tableau Public and you’ll be first in line for his next great viz!
Autres sujets pertinents

Meet Iron Viz 2024 Finalist Jessica Moon
 15 avril, 2024

Meet Iron Viz 2024 Finalist Pata Gogová
8 avril, 2024

Student to BI Analyst, How Tableau Can Lead to a Successful Data Career
 20 mars, 2024
Abonnez-vous à notre blog
Recevez toute l'actualité de Tableau.