Don’t let your data curiosities die! Create your own data set


Should I be worried about shark attacks when traveling to Australia? Why do I keep getting yellow skittles instead of the green ones? You can use data to answer these questions— but how do you find the data you need? Luckily, there is plenty of free, public data out there. And there are great resources (like this blog post or this discussion in the Tableau Community Forums) that share where to find it. But what if after scouring the web you still can’t find the data you’re looking for?
I ran into this problem in an unlikely setting: in my living room after watching an episode of Game of Thrones. The show is known for being as brutal as it is unpredictable, with no character safe from death (valar morghulis). After a particularly bleak episode back in 2016, a simple question popped into my head: “how many people have died in this show?” I scoured the web and even asked the Game of Thrones Subreddit for help. But I could only find qualitative data around events and main characters, not the specific numbers and details I wanted. Because I couldn’t find the right data to answer my question, I decided to create my own data set! And with the series now finished, I’ve recently updated my original, 2016 Game of Thrones data set and viz to include data from all eight seasons.

Creating a data set from scratch is a fantastic way to learn more about your topic and data. Plus, it can result in truly unique data visualization. But don’t worry, you don’t need to be a Zen Master to create your own data set! Here are four quick tips to guide your process, no matter the topic.
Tip 1: Determine your scope
After deciding to create my own data set on deaths in the show, more and more questions popped into my head. Who has the highest kill count? Are the main protagonists the characters doing the most killing? What is the favorite “method” of killing people? What place is the most dangerous?
When you’re creating a data set from scratch, it’s important to first think through your scope. Knowing which questions you want to answer can help you decide what data to capture— it would be terribly annoying to have to add a new dimension or measure into your data set when you’re already hours into collection! Similarly, knowing the questions you don’t want to answer can give your project reasonable guardrails. Don’t waste time collecting irrelevant data!
Tip 2: Set up rules for ambiguity
As I collected the data, I came across much more nuance and uncertainty than I had expected. I learned (the hard way) to set up rules for my data collection. Doing so can help keep your data consistent and fair, and it can save you loads of time.
Here’s some ambiguities I created rules for:
- How do I count battle casualties? Estimating off-screen battle casualties (and attributions) made the data inaccurate and messy. I decided to only include on-screen deaths, unless the death was explicitly stated in dialogue.
- Are animals weapons? Many characters rely on direwolves or dragons to vanquish their enemies. But who’s assigned the kill? I decided that if a character commands an animal to kill (dracarys!), the animal is killing for the character and would be considered a weapon. If an animal kills of its own volition, that animal is the killing character.
Tip 3: Have fun with the data collection process
Collecting data can be a long and painstaking process. Find creative ways to make that process more enjoyable! Set alarms to remind you about your original question or purpose in creating the data set. Blog about your process, and share it with communities that can offer enthusiasm and support (like the Tableau #DataFam!).
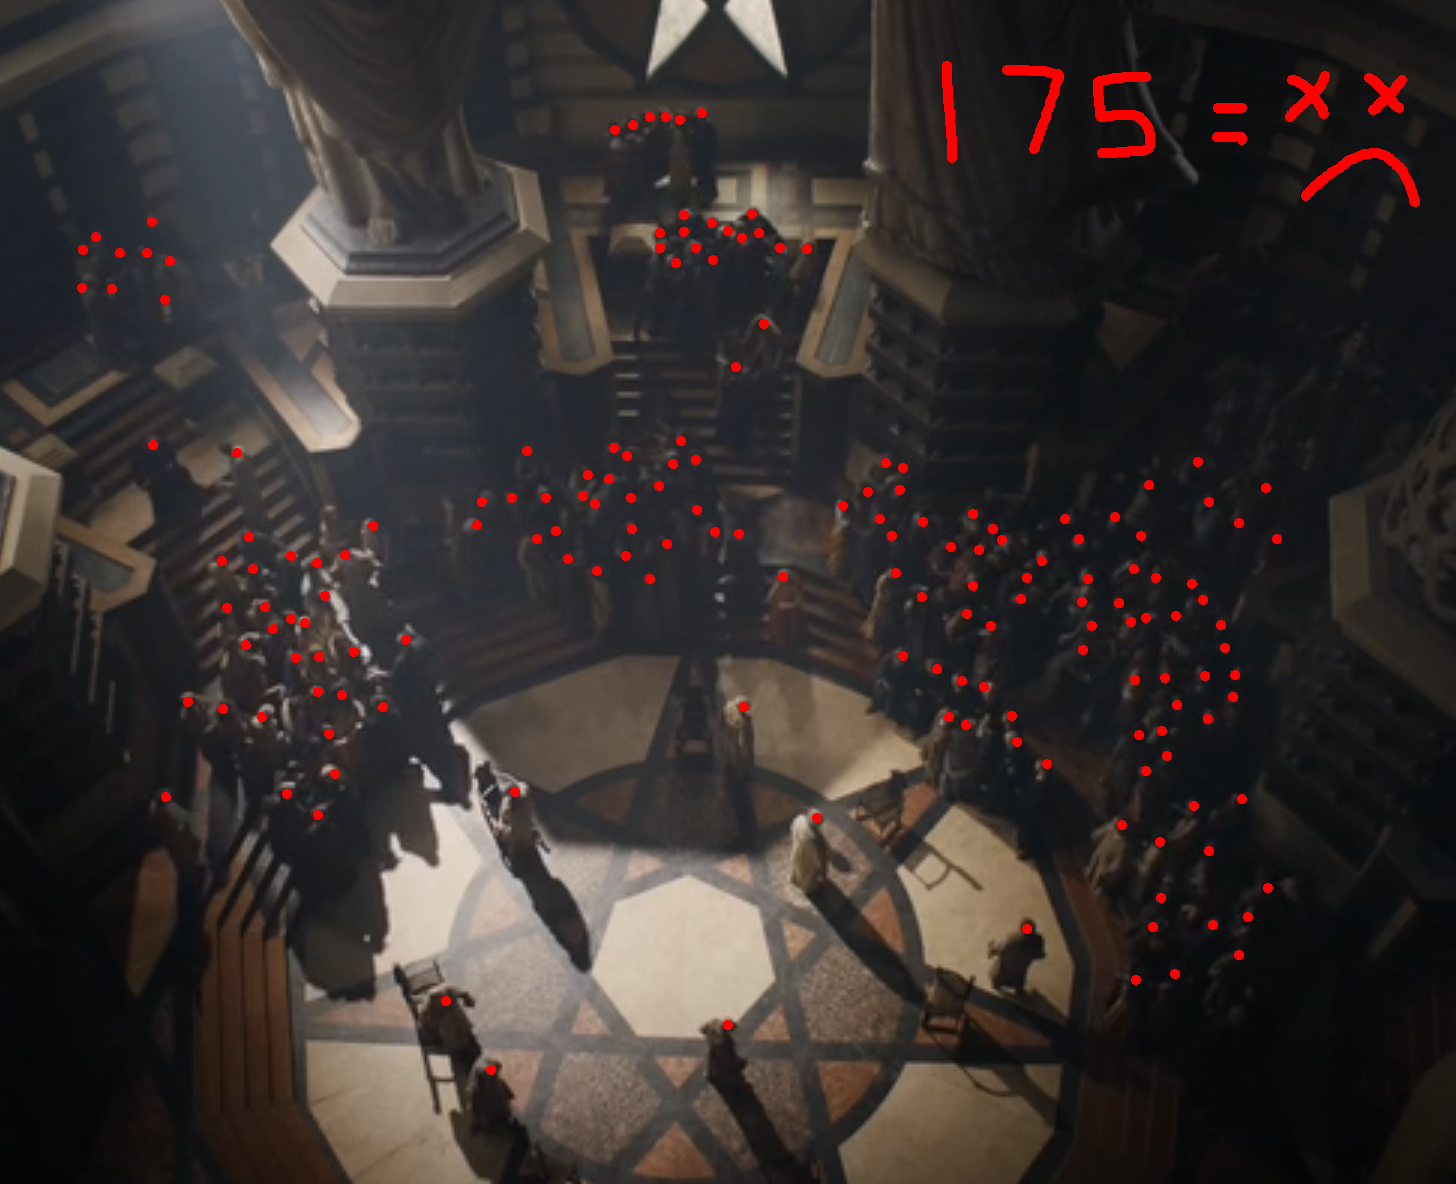
One creative method I used was getting tactile with my data collection. There are many scenes, particularly in the later seasons, where many characters died at once. I found myself accidentally double-counting deaths. The fun solution I came up with was to digitally "cross off" each kill. Here’s what I did when counting casualties of the Great Sept explosion.
Tip 4: Stop to validate
Once you’re around 10% through your collection process, stop and validate what you’ve created. Visualize your fledgling data set in Tableau, taking stock of whether you have the right data to answer your questions and build something interesting. Stopping early to validate your data set gives you an opportunity to make changes early on, rather than when you’re hours and hours into the process!
Looking for even more tips for creating your own data set? Check out Quantified Self’s Get Started guide. It’s full of advice that can be applied to your next data project.
It took me over 35 hours to create my data set. I’ve kept it private all this time as it represented a considerable time investment for me to collect it all. But with the show finished and my data questions finally answered, I’ve decided to share the data set publicly. You can download it here on data.world. So go on, see what you can visualize with this data set— then go out there and create a data set of your own!
Autres sujets pertinents

Meet Iron Viz 2024 Finalist Jessica Moon
 15 avril, 2024

Meet Iron Viz 2024 Finalist Pata Gogová
8 avril, 2024

Student to BI Analyst, How Tableau Can Lead to a Successful Data Career
 20 mars, 2024
Abonnez-vous à notre blog
Recevez toute l'actualité de Tableau.